Fig. 5
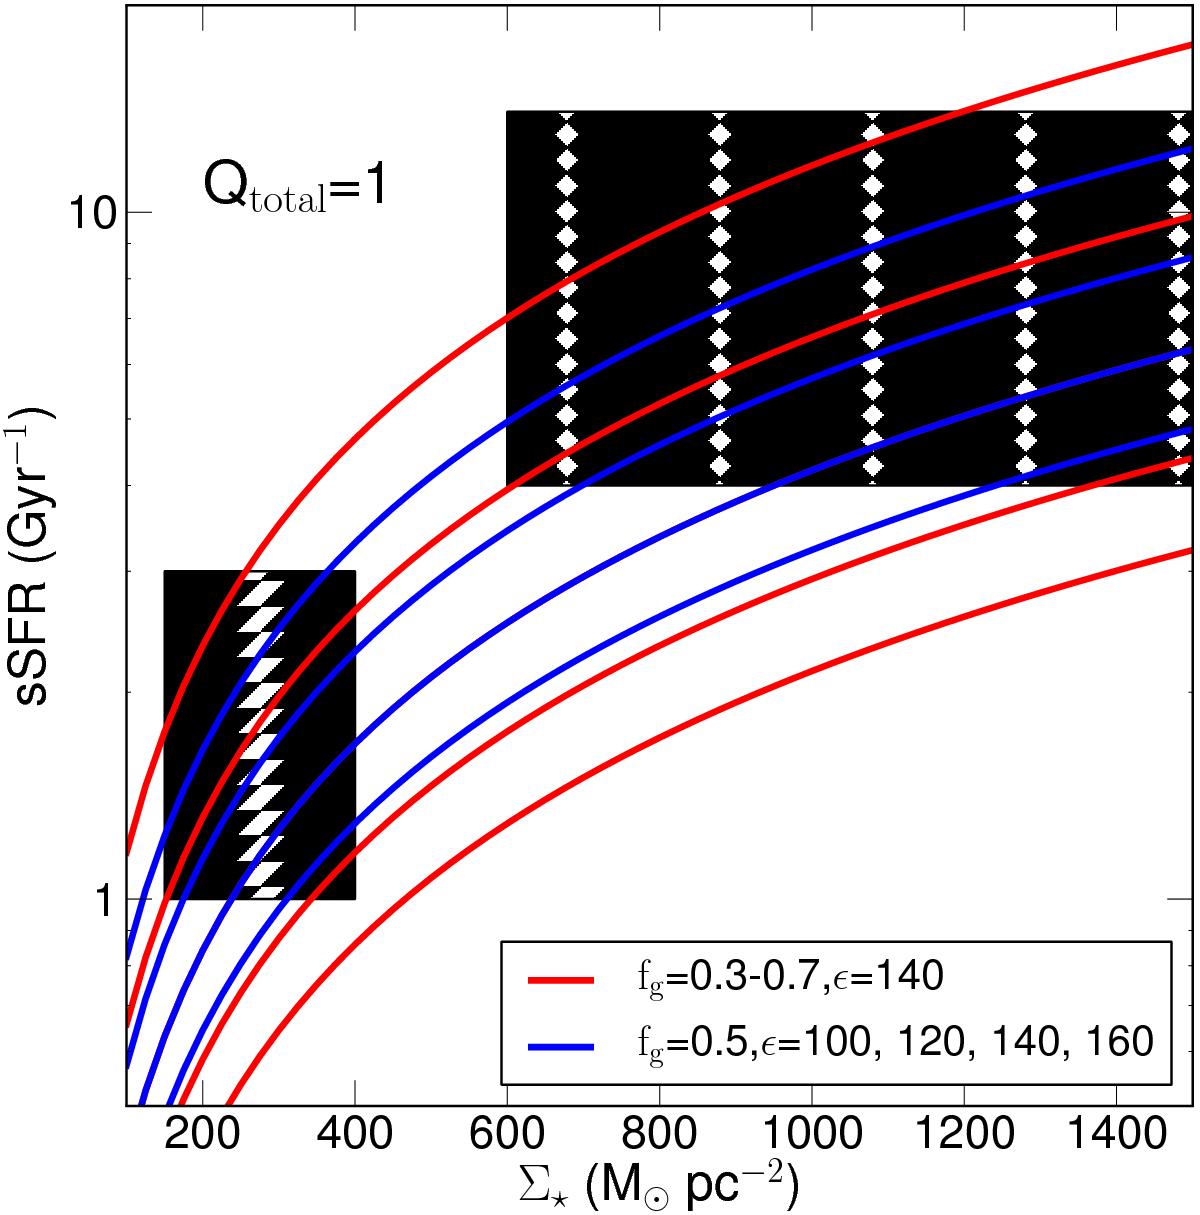
Specific star formation rate (sSFR, in Gyr-1) as a function of stellar mass surface density (Σ⋆, in M⊙ pc-2), for the hypothesis that the star formation drives galaxies towards the line of stability against star formation (Toomre parameter, Q = 1) as described in the text. The red and blue solid lines represents the sSFR where the energy input from massive stars generates enough turbulence to drive the global ISM towards Q ~ 1. The red solid lines represent where Q ~ 1 for a range of gas fractions (fg = 0.3 to 0.7) and for a constant σgas/σstars = 1, while the blue lines represent where Q = 1 for a constant gas fraction (fg = 0.5) and σgas/σstars = 1, but now for a range of energy input from massive stars into the turbulence of the ISM, ϵ = 100–160 km s-1 kpc yr![]() , where ϵ is the coupling between the star formation intensity and the velocity dispersion (Lehnert et al. 2009, 2013). The predicted sSFR values increase with increasing gas fraction but decrease with increasing ϵ. The hatched regions are the same as in Fig. 4.
, where ϵ is the coupling between the star formation intensity and the velocity dispersion (Lehnert et al. 2009, 2013). The predicted sSFR values increase with increasing gas fraction but decrease with increasing ϵ. The hatched regions are the same as in Fig. 4.
Current usage metrics show cumulative count of Article Views (full-text article views including HTML views, PDF and ePub downloads, according to the available data) and Abstracts Views on Vision4Press platform.
Data correspond to usage on the plateform after 2015. The current usage metrics is available 48-96 hours after online publication and is updated daily on week days.
Initial download of the metrics may take a while.