Fig. 4
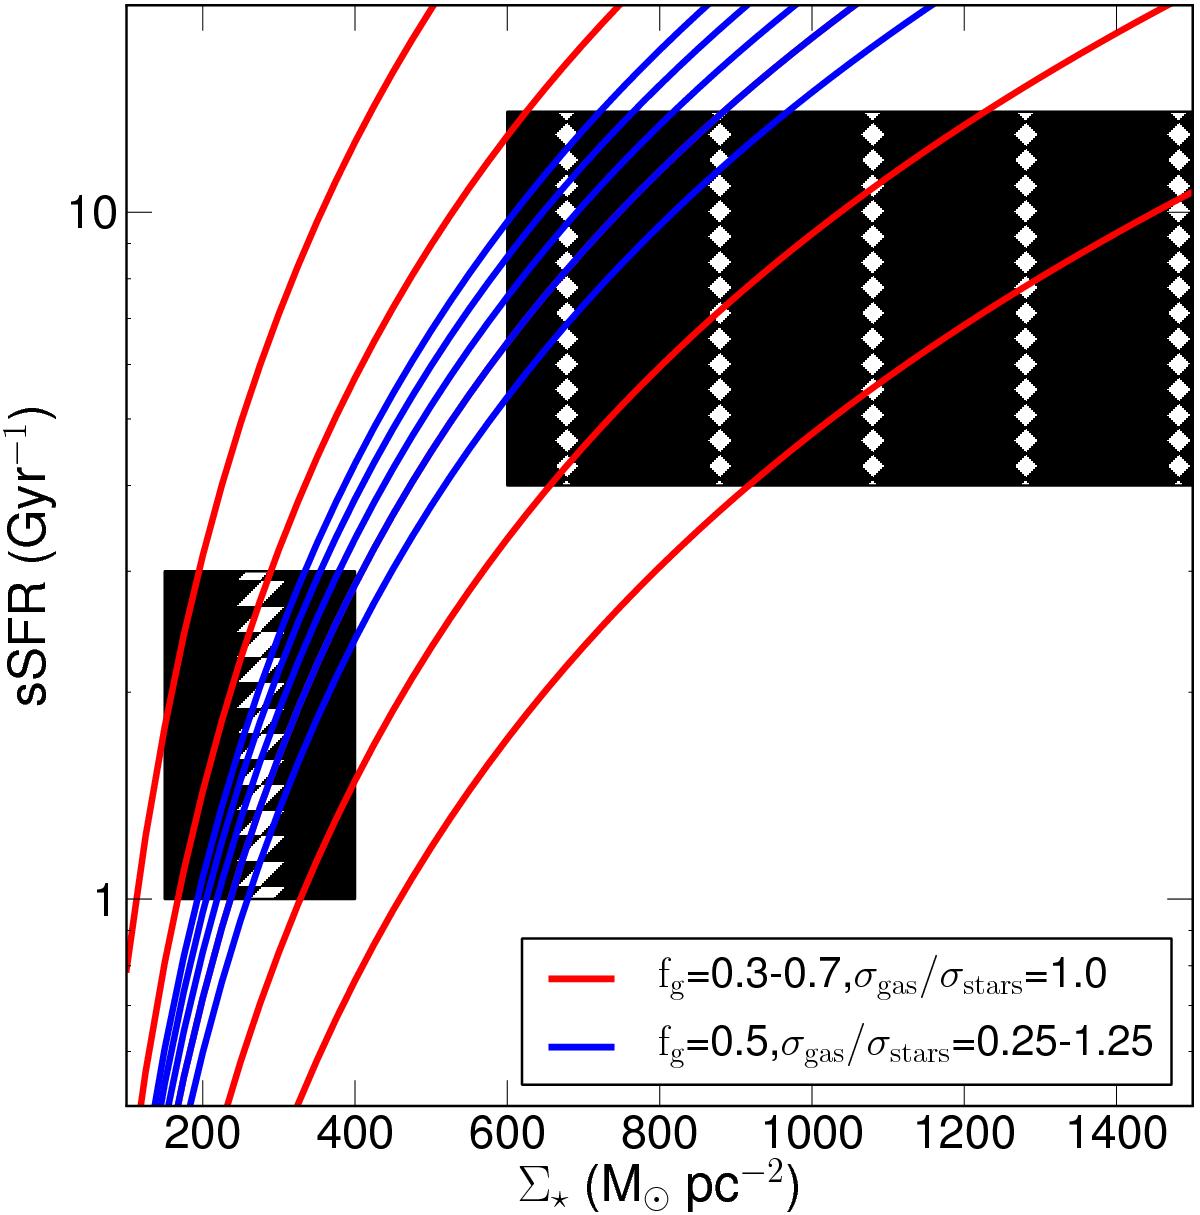
Specific star formation rate (sSFR, in Gyr-1) as a function of the stellar mass surface density (Σ⋆, in M⊙ pc-2) as predicted by a simple relation where the hydrostatic pressure and the thrust of the mechanical energy generated by intense star formation are equal. To span a range of possible sSFR in such a scenario, we vary the input values of the gas fraction, fg, or the velocity dispersion ratio of the gas and the stars, σgas/σstars. The red solid lines represent this equality for a range of gas fractions, fg = 0.3 to 0.7, and for a constant σgas/σstars = 1, while the blue lines represent this equality for a constant gas fraction, fg = 0.3, and a range of σgas/σstars = 0.25−1.25 in steps of 0.25. The hatched regions indicate approximately the observed range of stellar mass surface densities and sSFR at z ~ 2 (diagonally hatched region) and z ~ 5−7 (cross-hatched region; see text for details).
Current usage metrics show cumulative count of Article Views (full-text article views including HTML views, PDF and ePub downloads, according to the available data) and Abstracts Views on Vision4Press platform.
Data correspond to usage on the plateform after 2015. The current usage metrics is available 48-96 hours after online publication and is updated daily on week days.
Initial download of the metrics may take a while.