Fig. 2
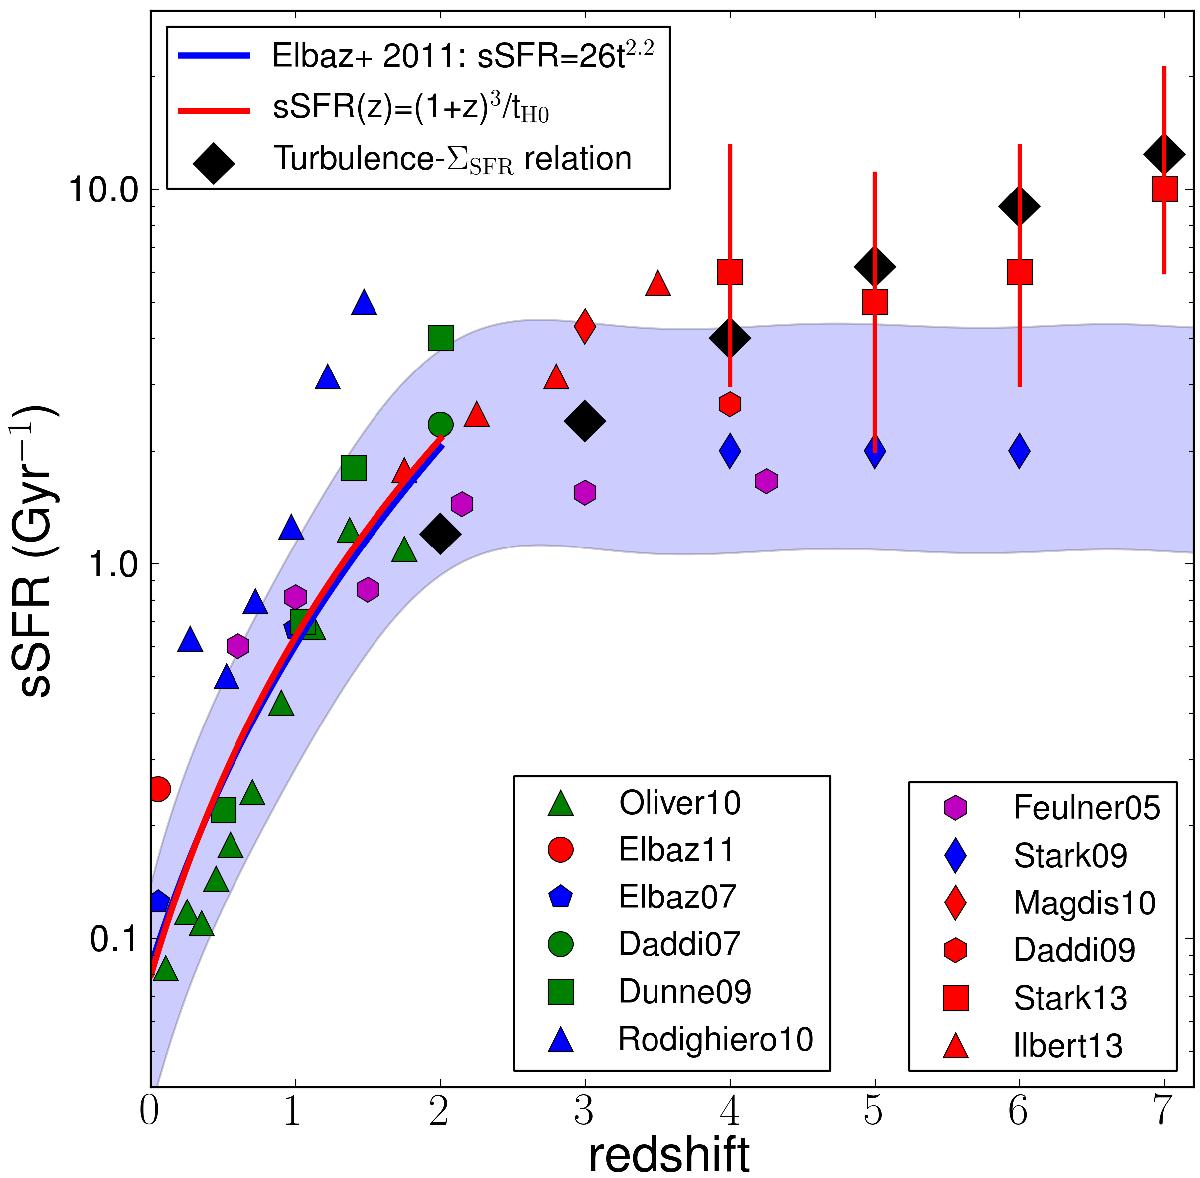
Specific star formation rate (sSFR, in Gyr-1) as a function of redshift. The various points represent measurements from the literature at M⋆ ~ 1010M⊙; see the references in the legend at the bottom right. We note that we have specifically shown the determinations from (Stark et al. 2013) with their uncertainties (red squares) because there is some controversy as to whether or not there is any evolution in the sSFR with increasing redshift beyond z = 2. Since the slope of the sSFR − M⋆ relation is approximately zero, the rate at which the sSFR evolves is largely independent of M⋆, except at the highest masses. The lines represent the best-fit relation from Elbaz et al. (2011) over the redshift range 0 to 2 (blue line) and a simple scenario, sSFR (z) = (1 + z)3/tH0 (where tH0 is the Hubble time at z = 0, red line), and the blue squares are the estimates for our hypothesis relating the turbulence to the star formation intensity (see text for details). The blue shaded region represents the scatter in the observed sSFR values (±0.3 dex). This rendition of the evolution of the sSFR is inspired by a similar plot in Weinmann et al. (2011).
Current usage metrics show cumulative count of Article Views (full-text article views including HTML views, PDF and ePub downloads, according to the available data) and Abstracts Views on Vision4Press platform.
Data correspond to usage on the plateform after 2015. The current usage metrics is available 48-96 hours after online publication and is updated daily on week days.
Initial download of the metrics may take a while.