| Issue |
A&A
Volume 576, April 2015
|
|
|---|---|---|
| Article Number | L15 | |
| Number of page(s) | 4 | |
| Section | Letters | |
| DOI | https://doi.org/10.1051/0004-6361/201526026 | |
| Published online | 14 April 2015 | |
ALMA view of the circumstellar environment of the post-common-envelope-evolution binary system HD 101584
1 Dept. of Earth and Space Sciences, Chalmers Univ. of Technology, Onsala Space Observatory, 43992 Onsala, Sweden
e-mail: hans.olofsson@chalmers.se
2 ESO, Karl-Schwarzschild-Str. 2, 85748 Garching bei München, Germany
3 Joint ALMA Observatory, Alonso de Cordova 3107, Vitacura, Santiago de Chile, Chile
4 ESO, Alonso de Cordova 3107, Vitacura, Santiago, Chile
5 Dept. of Physics and Astronomy, Uppsala University, Box 516, 75120 Uppsala, Sweden
Received: 5 March 2015
Accepted: 23 March 2015
Aims. We study the circumstellar evolution of the binary HD 101584, consisting of a post-AGB star and a low-mass companion, which is most likely a post-common-envelope-evolution system.
Methods. We used ALMA observations of the 12CO, 13CO, and C18O J = 2−1 lines and the 1.3 mm continuum to determine the morphology, kinematics, masses, and energetics of the circumstellar environment.
Results. The circumstellar medium has a bipolar hour-glass structure, seen almost pole-on, formed by an energetic jet, ≈150 km s-1. We conjecture that the circumstellar morphology is related to an event that took place ≈500 yr ago, possibly a capture event where the companion spiraled in towards the AGB star. However, the kinetic energy of the accelerated gas exceeds the released orbital energy, and, taking into account the expected energy transfer efficiency of the process, the observed phenomenon does not match current common-envelope scenarios. This suggests that another process must augment, or even dominate, the ejection process. A significant amount of material resides in an unresolved region, presumably in the equatorial plane of the binary system.
Key words: circumstellar matter / stars: individual: HD 101584 / stars: mass-loss / stars: AGB and post-AGB / radio lines: stars
© ESO, 2015
1. Introduction
The source HD 101584 (V885 Cen, IRAS 11385–5517) is bright at optical wavelengths (V ≈ 7 mag) with a spectral type A6Ia (Sivarani et al. 1999; Kipper 2005). Bakker et al. (1996b) presented optical and infrared data that indicate that it evolved from the asymptotic giant branch (AGB) at most a few 100 yr ago, and they estimated a (present-day) mass of ≈0.6 M⊙, a luminosity of ≈4000 L⊙, and a distance of ≈0.7 kpc.
Photometric and radial velocity variations show that HD 101584 has a binary companion. Bakker et al. (1996a) and Díaz et al. (2007) found periods of 218 and 144 days, respectively. Bakker et al. (1996a) inferred an essentially edge-on circumbinary disk to explain optical absorption lines. The absence of spectroscopic emission from the companion indicates that this is a low-mass main-sequence star.
Observing parameters.
Images from the Hubble Space Telescope (HST) show a diffuse circumstellar environment. There may be a ring of radius ≈1.̋5 roughly centred on the star (Sahai et al. 2007), that is almost circular, which suggests that we see it almost pole-on. The central star is bright, presumably because material around the polar axis of the system has partially been evacuated.
The circumstellar gas has been detected in molecular line emission. Olofsson & Nyman (1999) obtained 12CO and 13CO J = 1–0 and 2–1 single-dish map data. They found at least three kinematic components: a low-velocity, an intermediate-velocity, and a high-velocity component of total widths ≈15, ≈100, and ≈300 km s-1, respectively. The former two were spatially unresolved, and the high-velocity gas shows an east-west bipolar outflow with a Hubble-like velocity gradient, the most blue- and red-shifted emission at ≈5″ to the W and the E.
A narrower (≈80 km s-1), double-peaked OH 1667 MHz maser line was mapped by te Lintel Hekkert et al. (1992). The integrated OH emission is centred on the star (within 0.̋3), but is absent inside a radius of ≈1″. The velocity increases systematically along the position angle (PA) ≈ − 60° with the most blue- and red-shifted emission at ≈2″ to the SE and the NW. OH emission and a 10μm feature (Bakker et al. 1996a) indicate an O-rich (C/O < 1) circumstellar medium.
Hence, the circumstellar environment of HD 101584 appears to be consistent with that of a classic proto-planetary nebula (proto-PN): an equatorial density enhancement with an orthogonal, bipolar, high-velocity outflow (e.g., Alcolea et al. 2001, 2007; Castro-Carrizo et al. 2002; Sahai et al. 2006).
In this Letter we present data acquired with the Atacama Large Millimeter/sub-millimeter Array1 (ALMA) for the 12CO, 13CO, and C18O J = 2–1 line and the 1.3 mm continuum on HD 101584. In addition to this, we have detections of line emission from SiO, CS, H2S, SO, SO2, OCS, H2CO, and some of their isotopologues, which will be presented in forthcoming publications.
2. Observations
The 12CO, 13CO, and C18O J = 2–1 line data were obtained on 29 April 2014 with 35 antennas of the ALMA 12 m array in two frequency settings in band 6 (cycle 1). In both cases, the data contain four spectral windows (spw) of 1.875 GHz width and with 3840 channels. The observing parameters of the spw relevant for the data presented here are listed in Table 1.
The baselines range from 16 to 497 m. This means a maximum recoverable scale of ≈10′′. Bandpass and gain calibration were performed on J1107-4449 and J1131-5818 (3° separation from the target). Flux calibration was made using Ceres and Titan for the different tunings (Butler-JPL-Horizons 2012, ALMA Memo 594). Based on the calibrator fluxes determined in the two tunings, we estimate the absolute flux calibration to be accurate to within 5%.
The data were reduced using CASA 4.2.2. After corrections for the time and frequency dependence of the system temperatures and rapid atmospheric variations at each antenna using WVR data, bandpass and gain calibration were made. Poor phase coherence led to the flagging of three antennas in the 12CO tuning and one antenna in the 13CO tuning. Subsequently, for each individual tuning, self-calibration was performed on the strong continuum. Imaging was made using the CASA clean algorithm after a continuum subtraction was performed on the emission line data. Our final line images were created using natural weighting and the restoring beam given in Table 1. We produced a single continuum map combining both tunings with a line-free equivalent bandwidth of 10.2 GHz.
3. Observational results and discussion
3.1. Global characteristics
The 1.3 mm continuum map, overlaid on the global 12CO(2–1) map, is shown in Fig. 1. The total flux density, S230 = 112 mJy, falls short by almost a factor of four compared to the extrapolated spectral energy distribution (SED) model of Bakker et al. (1996b), suggesting a significant loss of flux originating from a region larger than 10′′. The morphology is complex with faint structures surrounding an intense inner region, where ≈70% of the total flux comes from inside a central 2′′ diameter circle.
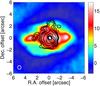 |
Fig. 1 1.3 mm continuum image (black contours) of HD 101584 superposed on the global 12CO(2–1) map (synthesized beam in the lower left corner). The dynamic-range-limited rms is 0.14 mJy beam-1 in a beam of |

 |
Fig. 2 SEST 12CO (black, offset +5 Jy) and the ALMA global 12CO (blue, offset +2 Jy), 13CO (red, offset +1 Jy, scaled ×1.5), and C18O (green, scaled ×3) J = 2–1 lines. |
The ALMA global CO line profiles are shown in Fig. 2. The systemic velocity, υsys, is estimated to be 42 ± 1 km s-1 (LSR). The ALMA total fluxes, integrated over the global line profiles, are 690, 150, and 18 Jy km s-1 for the 12CO, 13CO, and C18O J = 2–1 lines, respectively. The isotopologue line intensity ratios in the full velocity range and the central 20 km s-1 are 12CO/13CO ≈ 5 and 2 (solar value 89) and 13CO/C18O ≈ 8 and 4 (solar value 6), respectively. This indicates that opacity effects are significant in the 12CO line, affect the 13CO line, and that they increase significantly towards the central velocity range. Assuming that the 16O/18O ratio is solar (reasonable for a lower-mass star), the 13C may not be too far from solar.
The single-dish 12CO(2–1) flux is 850 Jy km s-1 (Olofsson & Nyman 1999), with an uncertainty of ≈20%, that is, some flux is probably missed by ALMA. Most likely, based on a detailed comparison of the ALMA global and the single-dish line profiles, no flux is missed in the central 20 km s-1 and at the extreme velocity peaks, while ≈25% of the flux is missed in the velocity range 10 < | υ − υsys | < 90 km s-1, Fig. 2. This suggests the presence of extended gas that has been efficiently accelerated.
The 12CO channel maps confirm the conclusion by Olofsson & Nyman (1999) of an E–W oriented high-velocity outflow, but also show additional considerable complexity, Fig. 3. The morphology of the emission is very symmetric with respect to the systemic velocity. The high-velocity outflow is narrow and directed at PA ≈ 90°. A complex ring-like structure is present in the velocity range –30–120 km s-1. The strong central emission is confined to a narrow velocity range, ≤20 km s-1.
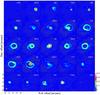 |
Fig. 3 Velocity-channel maps (Δυ = 12.5 km s-1) of the 12CO(J = 2–1) emission towards HD 101584 (synthesized beam in the lower left corner). The intensity scale unit is Jy beam-1 (noise rms 2 mJy beam-1). |
3.2. A jet, an hour-glass structure, and the central region
A number of different structures can be identified in different velocity ranges.
|υ − υsys|> 60 km s-1: the 12CO position-velocity (PV) diagram along the PA = 90° shows a jet-like structure, with a Hubble-like velocity gradient, reaching a peak velocity of ≈150 km s-1, Fig. 4. The emission is patchy along the jet, which ends in two sharp features at the extreme velocities. The PNe BD+30°3639 provides another example of such features (Bachiller et al. 2000). These may indicate that this is as far as the jet has travelled since its formation, or it has been stopped by surrounding material, or, at these distances, the jet is directed along the line of sight as a result of precessing, for example.
 |
Fig. 4 12CO(J = 2–1) position-velocity diagram along PA = 90°. The systemic velocity (solid) and the velocity ranges discussed in text (hashed) are indicated. The intensity scale unit is Jy beam-1. |
|υ − υsys|< 30 km s-1: the CO emission in the velocity range υsys ± 30 km s-1 is dominantly ring-like, as exemplified by the 13CO data in Fig. 5. The ring size increases with offset from the systemic velocity, and its centre position depends on velocity in a manner consistent with the direction of the velocity gradient of the high-velocity outflow. The 12CO PV diagram, Fig. 4, shows the expected morphology of a hollow structure, slightly tilted w.r.t. the line of sight at PA ≈ 90° in this velocity range, suggesting an hour-glass structure seen almost pole-on. We estimate the inclination angle, i, to be about half of the opening angle of the hour-glass structure, ≈10°. Surprisingly, the ring structure is elongated along PA ≈ 90°, as opposed to the expected PA ≈ 0°.
At lower brightness level there is evidence for another bipolar structure in this velocity range. It has a velocity gradient opposite to that of the major CO outflow and a different position angle (PA ≈ –45°), Figs. 3 and 4. The direction of the structure and its velocity gradient are roughly consistent with those of the OH 1667 MHz line.
 |
Fig. 5 Velocity-channel maps (Δυ = 4 km s-1) of the 13CO(J = 2–1) emission towards HD 101584 (synthesized beam in the lower left corner). The intensity scale unit is Jy beam-1 (noise rms 2 mJy beam-1). |
30 ≤ | υ − υsys | ≤ 60 km s-1: at ≈±30 km s-1 from υsys, the ring-like emission breaks up into a complex structure, yet very symmetric w.r.t. the centre, Fig. 3. The structure ends at offset velocities of ≈60 km s-1 in two compact features displaced by ≈1′′ on either side of the centre, along PA ≈ 90°. Assuming that this structure has its origin in a region close to the binary system, and adopting a tilt angle of 10°, a projected expansion length of 1 5, and an expansion velocity of 60 km s-1, the age is estimated to be ≈500 yr. With the same assumption on the tilt angle, the time scale of the jet is ≈520 yr. Thus, the complex structure and the jet could have their origins in the same event.
| υ − υsys | < 10 km s-1: using the C18O(2–1) line as a mass indicator, it is clear that a substantial fraction of the mass lies in the central region. About 55% of the integrated flux comes from the range υsys ± 10 km s-1. Further evidence for substantial mass in this region is the strong and narrow H2S(220–211) line, and the corresponding lines from its 33S and 34S isotopologues. Part of the emission in this velocity range comes from a circular region ≈2′′ in diameter (possibly related to the ring in the HST images), and part of the emission comes from an unresolved component at the center. The unresolved component is characterized by narrow spectral features, only a few km s-1 wide. It is prominent in high-energy (Eup ≈ 100 K) SO2 lines, for instance.
3.3. Mass, energy, and momentum estimates
A simple estimate of the dust mass using  (1)where B230 is the blackbody brightness at 230 GHz, with S230 = 112 mJy, D = 0.7 kpc, the dust opacity κ230 = 0.5 cm2 g-1 (Liseau et al. 2015), and an adopted dust temperature of 45 K (from the SED in Bakker et al. 1996b) gives Md ≈ 0.007 M⊙ (with an uncertainty of, at least, a factor of four). This suggests about a solar mass of gas in the central region, assuming a dust-to-gas ratio of 200. There probably is considerably more mass in an extended region (Bakker et al. 1996b estimated 0.02 M⊙ in total).
A simple estimate of the gas mass is obtained using  (2)where normal symbols are used for the constants, and f is the abundance with respect to H2, I the flux density integrated over velocity range, Q the partition function, Trot the rotational temperature, and Eu the upper level energy. Using the C18O(2–1) line, I = 18 Jy km s-1, fC18O = 4 × 10⁻⁷ (solar 16O/18O, fCO = 2 × 10⁻⁴ (O-rich envelope)), and Trot = 30 K (Bujarrabal et al. 2001), we obtain Mg ≈ 0.3 M⊙ (with some considerable uncertainty, e.g., the gas temperature probably varies over the source). More than half of it lies in the central 20 km s-1 range.
Using the C18O(2–1) line and the same assumptions as above, we find that the kinetic energy in the material accelerated to velocities ≥10 km s-1 is ≈4 × 1045 erg (a lower limit since extended flux from accelerated gas is missed). This lies in the middle of the range found by Bujarrabal et al. (2001), 1044−47 erg, for the bipolar outflows of a sample of 28 proto-PNe.
Likewise, we find a momentum of ≈1039 g cm s-1 in the accelerated gas, which lies in the middle of the range found by Bujarrabal et al. (2001), 1037−40 g cm s-1. The estimated momentum rate over 500 yr is ≈7 × 1028 erg cm-1, which is substantially higher than that available from radiation (L/c), ≈5 × 1026 erg cm-1, a common situation for proto-PNe (Bujarrabal et al. 2001). Hence, a different momentum source is required.
3.4. A scenario
Adopting the orbital parameters (period P = 218 days and velocity semi-amplitude K1 = 3 km s-1) and the mass estimate, M1 = 0.6 M⊙, of the post-AGB star (Bakker et al. 1996a,b), i = 10°, and a circular orbit (reasonable if we have a capture event), we derive a mass function of  (3)for the binary system, where M2 is the mass of the companion (a1 = K1P/2πsini). Thus, we estimate that M2 ≈ 0.6 M⊙ at a distance of a ≈ 0.7 AU (a2 = a1M2/M1, a = a1 + a2) to the primary. This could be the result of a capture event if the companion started at a distance sufficiently nearby for the AGB star to engulf it. The amount of orbital energy released is
  (4)where M1,i = 1.6 M⊙ (assuming that the present circumstellar material of ≈1 M⊙ comes from the AGB star), and assuming a2,i = 4 AU (sufficiently near to be captured).
There are considerable uncertainties in the orbital and energy estimates, and the common-envelope evolution scenario is complex with an uncertain energy transfer efficiency (Ivanova et al. 2013). But there is good evidence that we see the effect of a capture event in which a fair fraction of the mass of the AGB star was released as the companion spiraled inwards. Most of it remains in the equatorial plane of the binary, but some of it has been accelerated up to high velocities in the form of a bipolar jet. The complex structure at the end of the hour-glass structure may be the imprint of what took place during the capture. However, taken at face value, the released orbital energy is not enough, and another mechanism may augment, or even dominate, the ejection event, for instance a magnetic field of the (rapidly) spinning (υsini ≈ 50 km s-1, Bakker et al. 1996a) post-AGB star.
4. Conclusions
We have presented CO isotopologue emission line data on the post-AGB object HD 101584 obtained with ALMA and provided an initial analysis of the morphology, kinematics, masses, and energetics of the circumstellar medium. We conclude that the circumstellar medium of HD 101584 has been severely affected by the evolution of the binary system. A high-velocity jet (≈150 km s-1), directed at PA ≈ 90° and slightly tilted w.r.t. the line of sight, has excavated an hour-glass structure in the circumstellar medium. A complex structure is seen at the extreme velocities of the hour-glass structure. The estimated ages of the complex structure and the jet are comparable, ≈500 yr. A common origin of these phenomena such as the infall of the companion is therefore possible. However, taken at face value, the kinetic energy of the accelerated gas exceeds the released orbital energy during the capture event, and, further taking into account the expected efficiency of the process, the observed phenomenon does not match current common-envelope scenarios. This suggests that another process must augment, or even dominate, the ejection process. There appears to be substantial amount of material, maybe as much as a solar mass, in the central region, which is characterized by narrow spectral features that are only a few km s-1 wide. This may be the gas removed from the AGB star when the companion spiraled inwards. At low brightness levels there are indications of another bipolar structure. Its velocity gradient is opposite to that of the CO outflow and directed at PA ≈ − 45°.
This Letter makes use of the following ALMA data: ADS/JAO.ALMA#2012.1.00248.S. ALMA is a partnership of ESO (representing its member states), NSF (USA) and NINS (Japan), together with NRC (Canada) and NSC and ASIAA (Taiwan), in cooperation with the Republic of Chile. The Joint ALMA Observatory is operated by ESO, AUI/NRAO and NAOJ.
Acknowledgments
We are deeply grateful to the late Patrick Huggins, who played an instrumental role in defining this project. H.O. and W.V. acknowledge support from the Swedish Research Council. W.V. acknowledges support from the ERC through consolidator grant 614264. M.M. has received funding from the People Programme (Marie Curie Actions) of the EU’s FP7 (FP7/2007−2013) under REA grant agreement No. 623898.11.
References
- Alcolea, J., Bujarrabal, V., Sánchez Contreras, C., Neri, R., & Zweigle, J. 2001, A&A, 373, 932 [NASA ADS] [CrossRef] [EDP Sciences] [Google Scholar]
- Alcolea, J., Neri, R., & Bujarrabal, V. 2007, A&A, 468, L41 [NASA ADS] [CrossRef] [EDP Sciences] [Google Scholar]
- Bachiller, R., Forveille, T., Huggins, P. J., Cox, P., & Maillard, J. P. 2000, A&A, 353, L5 [NASA ADS] [Google Scholar]
- Bakker, E. J., Lamers, H. J. G. L. M., Waters, L. B. F. M., & Waelkens, C. 1996a, A&A, 310, 861 [Google Scholar]
- Bakker, E. J., Lamers, H. J. G. L. M., Waters, L. B. F. M., et al. 1996b, A&A, 307, 869 [Google Scholar]
- Bujarrabal, V., Castro-Carrizo, A., Alcolea, J., & Sánchez Contreras, C. 2001, A&A, 377, 868 [NASA ADS] [CrossRef] [EDP Sciences] [Google Scholar]
- Castro-Carrizo, A., Bujarrabal, V., Sánchez Contreras, C., Alcolea, J., & Neri, R. 2002, A&A, 386, 633 [NASA ADS] [CrossRef] [EDP Sciences] [Google Scholar]
- Díaz, F., Hearnshaw, J., Rosenzweig, P., et al. 2007, in IAU Symp. 240, eds. W. I. Hartkopf, P. Harmanec, & E. F. Guinan, 127 [Google Scholar]
- Ivanova, N., Justham, S., Chen, X., et al. 2013, A&ARv, 21, 59 [Google Scholar]
- Kipper, T. 2005, Balt. Astron., 14, 223 [NASA ADS] [Google Scholar]
- Liseau, R., Larsson, B., Lunttila, T., et al. 2015, A&A, submitted [Google Scholar]
- Olofsson, H., & Nyman, L.-Å. 1999, A&A, 347, 194 [NASA ADS] [Google Scholar]
- Sahai, R., Young, K., Patel, N. A., Sánchez Contreras, C., & Morris, M. 2006, ApJ, 653, 1241 [NASA ADS] [CrossRef] [Google Scholar]
- Sahai, R., Morris, M., Sánchez Contreras, C., & Claussen, M. 2007, AJ, 134, 2200 [NASA ADS] [CrossRef] [Google Scholar]
- Sivarani, T., Parthasarathy, M., García-Lario, P., Manchado, A., & Pottasch, S. R. 1999, A&AS, 137, 505 [NASA ADS] [CrossRef] [EDP Sciences] [Google Scholar]
- te Lintel Hekkert, P. T. L., Chapman, J. M., & Zijlstra, A. A. 1992, ApJ, 390, L23 [NASA ADS] [CrossRef] [Google Scholar]
All Tables
All Figures
|
Fig. 1 1.3 mm continuum image (black contours) of HD 101584 superposed on the global 12CO(2–1) map (synthesized beam in the lower left corner). The dynamic-range-limited rms is 0.14 mJy beam-1 in a beam of |
| In the text | |
|
Fig. 2 SEST 12CO (black, offset +5 Jy) and the ALMA global 12CO (blue, offset +2 Jy), 13CO (red, offset +1 Jy, scaled ×1.5), and C18O (green, scaled ×3) J = 2–1 lines. |
| In the text | |
|
Fig. 3 Velocity-channel maps (Δυ = 12.5 km s-1) of the 12CO(J = 2–1) emission towards HD 101584 (synthesized beam in the lower left corner). The intensity scale unit is Jy beam-1 (noise rms 2 mJy beam-1). |
| In the text | |
|
Fig. 4 12CO(J = 2–1) position-velocity diagram along PA = 90°. The systemic velocity (solid) and the velocity ranges discussed in text (hashed) are indicated. The intensity scale unit is Jy beam-1. |
| In the text | |
|
Fig. 5 Velocity-channel maps (Δυ = 4 km s-1) of the 13CO(J = 2–1) emission towards HD 101584 (synthesized beam in the lower left corner). The intensity scale unit is Jy beam-1 (noise rms 2 mJy beam-1). |
| In the text | |
Current usage metrics show cumulative count of Article Views (full-text article views including HTML views, PDF and ePub downloads, according to the available data) and Abstracts Views on Vision4Press platform.
Data correspond to usage on the plateform after 2015. The current usage metrics is available 48-96 hours after online publication and is updated daily on week days.
Initial download of the metrics may take a while.