Fig. 1
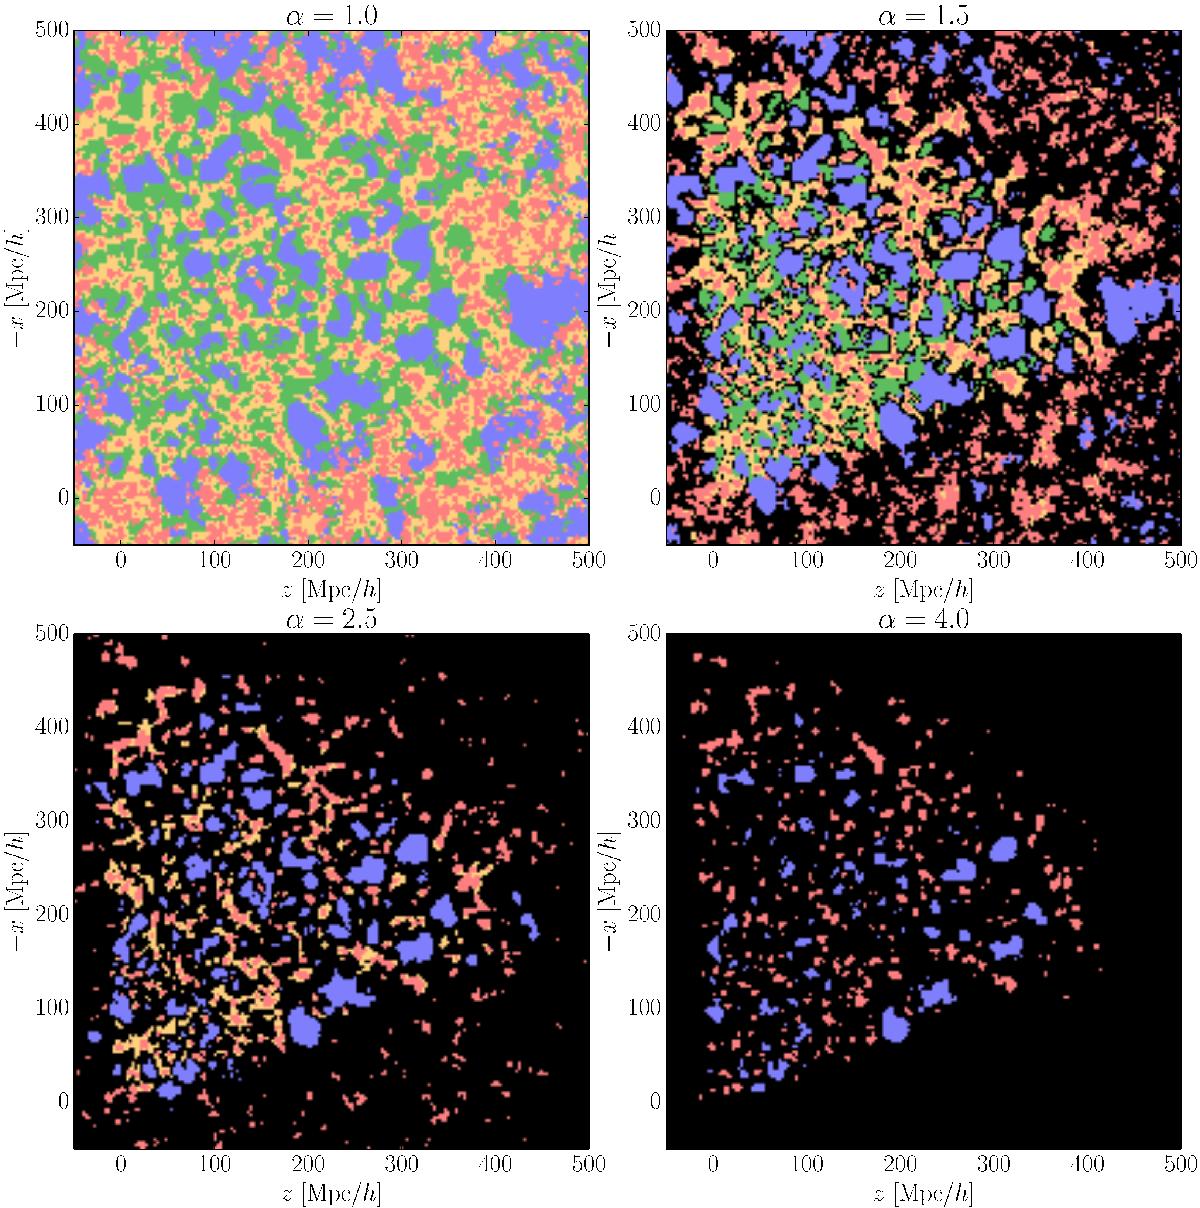
Slices through maps of structure types in the late-time large-scale structure, at a = 1. The colour coding is blue for voids, green for sheets, yellow for filaments, and red for clusters. Black corresponds to regions where data constraints are insufficient to make a decision. The parameter α, defined by Eq. (3), quantifies to the risk aversion in the map: α = 1.0 corresponds to the most speculative map of the large-scale structure, and maps with α ≥ 1 are increasingly conservative. These maps are based on the posterior probabilities inferred by Leclercq et al. (2015) and on the Bayesian decision rule subject of the present work.
Current usage metrics show cumulative count of Article Views (full-text article views including HTML views, PDF and ePub downloads, according to the available data) and Abstracts Views on Vision4Press platform.
Data correspond to usage on the plateform after 2015. The current usage metrics is available 48-96 hours after online publication and is updated daily on week days.
Initial download of the metrics may take a while.