| Issue |
A&A
Volume 576, April 2015
|
|
|---|---|---|
| Article Number | L13 | |
| Number of page(s) | 4 | |
| Section | Letters | |
| DOI | https://doi.org/10.1051/0004-6361/201525850 | |
| Published online | 14 April 2015 | |
VLT/MUSE view of the highly ionized outflow cones in the nearby starburst ESO338-IG04⋆
1 Department of Astronomy, Oskar Klein CentreStockholm University, AlbaNova University Centre, 106 91 Stockholm, Sweden
e-mail: arjan.bik@astro.su.se
2 Aix Marseille Université, CNRS, LAM (Laboratoire d’Astrophysique de Marseille), 13388 Marseille, France
Received: 9 February 2015
Accepted: 27 March 2015
Context. The Lyα line is an important diagnostic for star formation at high redshift, but interpreting its flux and line profile is difficult because of the resonance nature of Lyα. Trends between the escape of Lyα photons and dust and properties of the interstellar medium (ISM) have been found, but detailed comparisons between Lyα emission and the properties of the gas in local high-redshift analogs are vital for understanding the relation between Lyα emission and galaxy properties.
Aims. For the first time, we can directly infer the properties of the ionized gas at the same location and similar spatial scales of the extended Lyα halo around the local Lyα emitter and Lyman-break galaxy analog ESO 338-IG04.
Methods. We obtained VLT/MUSE integral field spectra. We used ionization parameter mapping of the [S ii]/[O iii] line ratio and the kinematics of Hα to study the ionization state and kinematics of the ISM of ESO 338-IG04.
Results. The velocity map reveals two outflows, one toward the north, the other toward the south of ESO 338. The ionization parameter mapping shows that the entire central area of the galaxy is highly ionized by photons leaking from the H ii regions around the youngest star clusters. Three highly ionized cones have been identified, of which one is associated with an outflow detected in the Hα. We propose a scenario where the outflows are created by mechanical feedback of the older clusters, while the highly ionized gas is caused by the hard ionizing photons emitted by the youngest clusters. A comparison with the Lyα map shows that the (approximately bipolar) asymmetries observed in the Lyα emission are consistent with the base of the outflows detected in Hα. No clear correlation with the ionization cones is found.
Conclusions. The mechanical and ionization feedback of star clusters significantly changes the state of the ISM by creating ionized cones and outflows. The comparison with Lyα suggests that especially the outflows could facilitate the escape of Lyα photons.
Key words: galaxies: starburst / galaxies: individual: ESO338-IG04 / galaxies: kinematics and dynamics
© ESO, 2015
1. Introduction
Lyα is one of the most important diagnostic lines in extragalactic astrophysics. The line is thought to be bright in star-forming galaxies, allowing their detection at high redshift. However, due to the resonance nature of the Lyα line, relating the line strength to star formation is not a straightforward process, and Lyα needs to be used only with great care as a physical probe. A Lyα photon scatters in neutral H i gas until it escapes or is absorbed by dust. This means that Lyα is a complicated function of not only the ionizing power and extinction, but also of the amount (Pardy et al. 2014) and kinematics (Kunth et al. 1998; Wofford et al. 2013) of H i.
To understand the relation between Lyα and these properties, detailed studies of local analogs of Lyα-emitting galaxies are needed (Östlin et al. 2014; Hayes et al. 2014). Observations of nearby galaxies have shown that stellar feedback creates highly ionized cones in the neutral medium, allowing the ionized radiation to escape from the galaxy (Zastrow et al. 2011, 2013). This would make the amount of escaping Lyman-continuum (LyC) photons a strong function of the orientation under which we observe the galaxy.
In this Letter, we compare for the first time the spatially resolved Lyα emission, obtained with the Hubble Space Telescope (HST; Hayes et al. 2005; Östlin et al. 2009), with the ionization state and kinematics of the ionized gas in the halo of the brightest Lyα emitter in the local Universe and Lyman-break galaxy (LBG) analog, the starburst galaxy ESO 338-IG04 (Tololo 1924-416, hereafter ESO 338). We present high-quality MUSE observations allowing a detailed comparison between the spatial distribution of the Lyα emission and potential outflows in this galaxy. In Sect. 2 we describe the observations and data reduction. In Sect. 3 we present the results of the ionization mapping and kinematics of Hα toward the galaxy. We conclude with discussion and conclusions in Sect. 4.
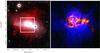 |
Fig. 1 Left: reconstructed VRHα color image of ESO 338 as seen by MUSE. The Hα image is not continuum subtracted. The black asterisks mark the location of the two foreground stars. The white box shows the region displayed in the panel to the right. Right: reconstructed three-color images based on narrow-band images taken with HST of Lyα (blue), [O iii] λ5007 Å (green) and Hα (red). |
2. Observations and data reduction
ESO 338 has been observed with the integral field spectrograph Multi-Unit Spectroscopic Explorer (MUSE; Bacon et al. 2010) mounted on the Very Large Telescope (VLT) on Paranal, Chile. The observations were performed during the first science verification run. The observations are taken in the no-AO mode in the extended wavelength setting, providing spectra between 4600 and 9350 Å in a field of view of 1 □′ with a 0.2′′ pixel scale. The observations were performed on 2014 June 25, split over two observing blocks with four frames of 750 s, rotated by 90°, resulting in an integration time of 100 min. The measured seeing was 0.9′′ in the V band. The data were reduced using the ESO pipeline version 0.18.5 (Weilbacher et al., in prep.). Flux calibration is based on observations of the spectrophotometric standard star GD 153.
We present the first results derived from this rich data set. Broadband images in V and R were extracted using the V and R transmission curves. Emission line maps of [S ii] λ6717 Å and λ6731 Å, [O iii] λ5007 Å, and Hαλ6563 Å were extracted. The emission line maps were constructed by numerically integrating below the emission line, and the continuum was subtracted by averaging the continuum blue- and redward of the line. To enhance the low-surface brightness features, we made use of the weighted Voronoi tesselations binning algorithm by Diehl & Statler (2006), which is a generalization of the algorithm developed by Cappellari & Copin (2003) . A minimum signal-to-noise ratio (S/N) of 20 has been chosen for the [S ii] λ6717 Å line with a maximum cell area of 100 pixels (4 □′′). This Voronoi pattern was applied to all emission line maps. A Gaussian profile was fitted to the Hα line using the MPFIT (Markwardt 2009) to calculate the velocity map.
3. Results
Figure 1 (left) shows a VRHα three-color image extracted from the MUSE observations of ESO 338. The reconstructed V and R images reveal the continuum emission of the galaxy and show numerous star clusters (Östlin et al. 1998). The Hα map shows a large ionised halo around the galaxy (Bergvall & Östlin 2002), extending as far as 6 kpc from the center of the galaxy (assuming a distance of 37.5 Mpc, Östlin et al. 1998).
The right panel of Fig. 1 shows a composite of HST observations of Hα, O iii, and Lyα of the central part of ESO 338. The MUSE observations allow us to study the gas far out in the halo, while the HST observations give detailed information about the small scales (Hayes et al. 2005; Östlin et al. 2009).
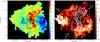 |
Fig. 2 Left: velocity map of Hα as derived from a Gaussian fit of the emission line. As systemic velocity we have chosen 2841 km s-1. Overplotted are the contours of the Lyα-continuum subtracted emission (Östlin et al. 2009) with contour levels of 0.3, 0.9 and 2 × 10-19 erg/s/cm2/Å. Right: [S ii]/[O iii] line ratio tracing the ionization parameter throughout the galaxy (Pellegrini et al. 2012). All cells with a flux lower than 1.7 × 10⁻¹⁹ erg/s/cm2/Å, corresponding to a S/N = 20 for the S ii λ6717 Å line, have been removed from the plot. The contours show the Hα velocity map with contours at −15 (dashed), 15, 30, and 45 (solid) km s-1. |
3.1. Ionization parameter
We applied the technique of ionization parameter mapping to determine the degree of ionization and the optical depth for Lyα photons using the [SII] (λ6717 Å+λ6731 Å)/[OIII] (λ5007 Å) line ratio (Pellegrini et al. 2012). The right panel of Fig. 2 shows the [S ii]/[O iii] line ratio calculated using the Voronoi tessellated data. The observed ratio varies from unity in the western and eastern parts of the halo to 0.03 in the center of ESO 338. This extreme line ratio shows that there is a high production of hν> 34 eV photons compared to where [S ii]/[O iii] is 1. Comparing these low values with theoretical prediction by Pellegrini et al. (2012) shows similarities to the models with an O3V star as ionizing star. The lowest values are found coincident with the positions of young (<2 Myr) star clusters (Östlin et al. 2003), containing these very early O stars.
The central ~2 kpc of the galaxy halo show an average value of 0.1 of the [S ii]/[O iii] ratio, indicating that entire center of ESO 338 is highly ionized. This is probably caused by the H ii regions being optically thin for LyC photons, which allows them to leak out and ionize of the gas outside the H ii regions. The gas becomes optically thick for LyC photons only in the western and eastern outer regions of the galaxy. This pattern mimics the behavior of a giant H ii region, as found for similar galaxies (Haro 11, Cormier et al. 2012), and confirms the existence of an in-out ionizing front that modifies the interstellar medium (ISM) states of the galaxy. Several cones of highly ionized gas expanding all the way into the galaxy halo are visible. The most prominent ionization cones are in the northwest (nr 1) and southeast direction (nr 3). An additional ionization cone (nr 2) is found in the eastern direction.
Changes for instance in extinction and abundance might also result in changes in line ratios. However, the extinction toward ESO 338 is very low, with a luminosity-averaged value of close to 0 mag (Östlin et al. 2003). This is confirmed by our own Hβ/Hα map, where maximum values of E(B − V) = 0.2 mag are measured toward some clusters. To reproduce the observed change in [S ii]/[O iii] ratio, E(B − V) values as high as 3.5 mag are needed (Calzetti et al. 2000). To test whether the abundance variations might cause the observed pattern, we calculated the N2 and S3O3 indices (Stasińska 2006). Spatial variations were found, but not in the same geometry as for [S ii]/[O iii]. The same spatial variations, however, were found in line ratio maps of lines originating from different ionization potentials, such as Hα/[O iii] and [S ii]/[S iii], suggesting that the changes in the [S ii]/[O iii] ratio are dominated by variations in ionization.
3.2. Kinematics
To relate the detected ionization cones to galactic-scale outflows, we compared the map of ionization parameters with the Hα velocity map. Previous studies on the Hα velocity field of ESO 338 based on Fabry-Perot data (Östlin et al. 1999, 2001) and long-slit spectroscopy (Cumming et al. 2008) concluded that either the galaxy is not in equilibrium, or the Hα velocities do not trace the gravitational potential and are dominated by feedback.
With our high-quality MUSE data we clearly detected several high-velocity outflows (Fig. 2) and confirm that most of their observed velocity profile is indeed dominated by the outflow emission. As a result of the irregular velocity profile, the systemic velocity is only poorly defined. We measured the velocity of the Hα line of the intensity-weighted average over the part of the galaxy where continuum is visible. This resulted in a observed velocity of 2841 ± 1 km s-1, consistent with HIPASS 21 cm measurements (Meyer et al. 2004). Measurements of absorption lines of Na i (λ 5889.9 Å, 5895.9 Å) and Mg i (λ 5167.3 Å, 5172.7 Å, 5183.6 Å) in the intensity-weighted spectrum show similar values, albeit at lower accuracy because of their low equivalent width. This is consistent with previous studies where no velocity difference was found between stellar absorption lines and nebular emission lines (Cumming et al. 2008; Sandberg et al. 2013). After correcting for the heliocentric velocity, we chose the systemic velocity to be 2841 km s-1 as measured on the Hα line of the integrated spectrum (Fig. 2).
A complex of outflows coincides with the northwestern ionization cone, suggesting that this cone is created by the expanding, highly ionized gas that is expelled from the galaxy by stellar feedback. A similar outflow is found to the south of the galaxy, but this outflow is not aligned with an ionization cone. In addition, two expanding arcs are detected in the velocity map, one redshifted, roughly coinciding with ionization cone 3, and a blueshifted arc west of the same ionization cone. The outflows show maximum projected velocities of 50 km s-1, which is slower than outflows in M 82 (Shopbell & Bland-Hawthorn 1998) and NGC 1569 (Westmoquette et al. 2008), for instance, which were derived from data with much higher spectral resolution. We found no evidence for multiple components in Hα, probably because of the insufficient spectra resolution.
The MUSE data are much deeper than the previous spectroscopic Hα observations of ESO 338 of Östlin et al. (1999) and Cumming et al. (2008). This allowed us to trace the halo much farther out than before (6 kpc, 1′ = 11 kpc). In addition to the outflows, we find evidence for a gradient in the velocity of the halo gas. The observed velocities increase from west to east between −50 km s-1 and +10 km s-1, similar to the gradient observed in the H i emission of ESO 338 (Cannon et al. 2004).
4. Discussion and conclusions
We presented MUSE integral field observations of the local Lyα-emitting galaxy ESO 338. We identified several highly ionized channels and found evidence of galaxy-scale outflows driven by stellar feedback in the central part of the galaxy. ESO 338 is perfectly suited for studying the relation between the Lyα escape and ionization channels and outflows because it is the LBG analog closest to us.
4.1. Feedback
A comparison between the ionization cones and the outflows shows that there is no one-to-one match. The northern outflow aligns with ionization cone nr 1. The southern part of the galaxy halo shows a different geometry. The outflow and ionization cone nr 3 are not aligned and are probably two unrelated features. We did not detect velocity changes for ionization cone nr 2.
The two arc features detected in the velocity map might be part of the same expanding structure. Figure 2 shows that the blueshifted arc marks the edge of the highly ionized region, while the red arc is located at the back side of the galaxy expanding away from us. With this hypothesis, they could trace the shock front created by the expansion of the hot, overpressured gas from the center of the galaxy into the more neutral ISM.
Massive stars are sources of feedback, therefore they are the main agents of the modification of the ISM on both local and galactic scales. The large majority of massive stars are in clusters because ESO 338 has a very high cluster formation efficiency (50%, Adamo et al. 2011). Hard ionizing photons are only produced by the most massive stars, which in turn means that they are produced only in clusters with ages younger than ~4 Myr, while the mechanical energy released by stellar winds and supernovae remains roughly constant for ~30 Myr (Leitherer et al. 1999). Östlin et al. (2003) derived the star formation history based on the detected clusters and showed that the star formation increased 20−30 Myr ago and again 6−10 Myr ago, and it increased a little during the last 3 Myr. The oldest star formation burst has injected the most mechanical energy into the ISM and therefore might be responsible for several of the observed outflows. The LyC photons responsible for the ionized cones are created by the most recent increase in star formation. These channels might be outflow cones created by the older generation of clusters and might be re-ionized by the younger generation.
That not all ionization cones are associated with outflows might also be caused by projection effects. The ionization cones are detected at any inclination because what we measure is the average ionization along the line of sight. Only if the cone originates in the center and is directed straight toward us will the cone not be detected because the center is already highly ionized. The detection bias introduced by velocity measurements is different, such that if the outflows are in the plane of the sky, they will not be detected in the velocity map. A more detailed comparison with higher spatial resolution between the outflows and clusters is needed to test these hypotheses.
4.2. Lyα escape
The Lyα emission map of ESO 338 (Fig. 1) shows strong emission and absorption toward the young star clusters in the center of the galaxy (Hayes et al. 2005). The Lyα photons are produced in the H ii regions surrounding the star clusters. The low [S ii]/[O iii] ratio of the central area of the entire galaxy shows that these H ii regions are optically thin and leak LyC photons.
As noted by Hayes et al. (2005), the clusters in ESO338 are surrounded by a diffuse halo of Lyα caused by the scattering of Lyα photons in the neutral ISM. In addition to this scattering halo, two flux enhancements in the Lya map are observed as well: One at the northern side of the galaxy and one toward the southwest, and a relation with possible outflows has been proposed (Hayes et al. 2005; Östlin et al. 2009). With the MUSE data we can relate these asymmetries to the outflows detected in the Hα velocity map. The inner parts of the two detected outflows in the velocity map line up with the Lyα asymmetries. The expanding gas in the outflow causes the resonance wavelength to shift away from the Lyα wavelength, which allows the Lyα-photons to escape instead of being scattered.
The observed outflows as well as the geometry of the Lyα emission shows that the determination of the Lyα escape fraction will depend strongly on the ISM geometry of the galaxy. If we observe the galaxy through an outflow cone, the observed Lyα flux may be much higher than for the way we observe ESO 338. This allows testing theoretical models that predict that the variations of Lyα are a function of the viewing angle of the ionization cones (Laursen et al. 2009; Behrens et al. 2014).
We did not observe a correlation with the ionization cones, apart from where the ionization cone aligns with the northern outflow. This might suggest that outflows are more effective in enhancing the Lyα escape fraction than ionization cones, which are more likely to facilitate the LyC continuum escape (e.g., Zastrow et al. 2013). Interestingly, ESO 338 is also a good candidate galaxy in which to study the emission of LyC radiation. Leitet et al. (2013) estimated a LyC escape fraction of ≈16% based upon the residual intensity in the usually saturated C ii λ = 1036 Å absorption line.
Acknowledgments
We thank the anonymous referee for useful comments that helped to improve the paper. We acknowledge the ESO science verification team for support and execution of the observations. M.H. and G.Ö. received support from the Swedish research council (VR) and the Swedish National Space Board (SNSB).
References
- Adamo, A., Östlin, G., & Zackrisson, E. 2011, MNRAS, 417, 1904 [NASA ADS] [CrossRef] [Google Scholar]
- Bacon, R., Accardo, M., Adjali, L., et al. 2010, SPIE Conf. Ser., 7735, 08 [NASA ADS] [Google Scholar]
- Behrens, C., Dijkstra, M., & Niemeyer, J. C. 2014, A&A, 563, A77 [NASA ADS] [CrossRef] [EDP Sciences] [Google Scholar]
- Bergvall, N., & Östlin, G. 2002, A&A, 390, 891 [NASA ADS] [CrossRef] [EDP Sciences] [Google Scholar]
- Calzetti, D., Armus, L., Bohlin, R. C., et al. 2000, ApJ, 533, 682 [NASA ADS] [CrossRef] [Google Scholar]
- Cannon, J. M., Skillman, E. D., Kunth, D., et al. 2004, ApJ, 608, 768 [NASA ADS] [CrossRef] [Google Scholar]
- Cappellari, M., & Copin, Y. 2003, MNRAS, 342, 345 [NASA ADS] [CrossRef] [Google Scholar]
- Cormier, D., Lebouteiller, V., Madden, S. C., et al. 2012, A&A, 548, A20 [NASA ADS] [CrossRef] [EDP Sciences] [Google Scholar]
- Cumming, R. J., Fathi, K., Östlin, G., et al. 2008, A&A, 479, 725 [NASA ADS] [CrossRef] [EDP Sciences] [Google Scholar]
- Diehl, S., & Statler, T. S. 2006, MNRAS, 368, 497 [NASA ADS] [CrossRef] [Google Scholar]
- Hayes, M., Östlin, G., Mas-Hesse, J. M., et al. 2005, A&A, 438, 71 [NASA ADS] [CrossRef] [EDP Sciences] [Google Scholar]
- Hayes, M., Östlin, G., Duval, F., et al. 2014, ApJ, 782, 6 [NASA ADS] [CrossRef] [Google Scholar]
- Kunth, D., Mas-Hesse, J. M., Terlevich, E., et al. 1998, A&A, 334, 11 [NASA ADS] [Google Scholar]
- Laursen, P., Razoumov, A. O., & Sommer-Larsen, J. 2009, ApJ, 696, 853 [Google Scholar]
- Leitet, E., Bergvall, N., Hayes, M., Linné, S., & Zackrisson, E. 2013, A&A, 553, A106 [NASA ADS] [CrossRef] [EDP Sciences] [Google Scholar]
- Leitherer, C., Schaerer, D., Goldader, J. D., et al. 1999, ApJS, 123, 3 [NASA ADS] [CrossRef] [Google Scholar]
- Markwardt, C. B. 2009, in Astronomical Data Analysis Software and Systems XVIII (San Francisco: ASP), ASP Conf. Ser., 411, 251 [NASA ADS] [Google Scholar]
- Meyer, M. J., Zwaan, M. A., Webster, R. L., et al. 2004, MNRAS, 350, 1195 [NASA ADS] [CrossRef] [Google Scholar]
- Östlin, G., Bergvall, N., & Roennback, J. 1998, A&A, 335, 85 [NASA ADS] [Google Scholar]
- Östlin, G., Amram, P., Masegosa, J., Bergvall, N., & Boulesteix, J. 1999, A&AS, 137, 419 [NASA ADS] [CrossRef] [EDP Sciences] [Google Scholar]
- Östlin, G., Amram, P., Bergvall, N., et al. 2001, A&A, 374, 800 [NASA ADS] [CrossRef] [EDP Sciences] [Google Scholar]
- Östlin, G., Zackrisson, E., Bergvall, N., & Rönnback, J. 2003, A&A, 408, 887 [NASA ADS] [CrossRef] [EDP Sciences] [Google Scholar]
- Östlin, G., Hayes, M., Kunth, D., et al. 2009, AJ, 138, 923 [NASA ADS] [CrossRef] [Google Scholar]
- Östlin, G., Hayes, M., Duval, F., et al. 2014, ApJ, 797, 11 [NASA ADS] [CrossRef] [Google Scholar]
- Pardy, S. A., Cannon, J. M., Östlin, G., et al. 2014, ApJ, 794, 101 [NASA ADS] [CrossRef] [Google Scholar]
- Pellegrini, E. W., Oey, M. S., Winkler, P. F., et al. 2012, ApJ, 755, 40 [NASA ADS] [CrossRef] [Google Scholar]
- Sandberg, A., Östlin, G., Hayes, M., et al. 2013, A&A, 552, A95 [NASA ADS] [CrossRef] [EDP Sciences] [Google Scholar]
- Shopbell, P. L., & Bland-Hawthorn, J. 1998, ApJ, 493, 129 [NASA ADS] [CrossRef] [Google Scholar]
- Stasińska, G. 2006, A&A, 454, L127 [NASA ADS] [CrossRef] [EDP Sciences] [Google Scholar]
- Westmoquette, M. S., Smith, L. J., & Gallagher, J. S. 2008, MNRAS, 383, 864 [NASA ADS] [CrossRef] [Google Scholar]
- Wofford, A., Leitherer, C., & Salzer, J. 2013, ApJ, 765, 118 [NASA ADS] [CrossRef] [Google Scholar]
- Zastrow, J., Oey, M. S., Veilleux, S., McDonald, M., & Martin, C. L. 2011, ApJ, 741, L17 [NASA ADS] [CrossRef] [Google Scholar]
- Zastrow, J., Oey, M. S., Veilleux, S., & McDonald, M. 2013, ApJ, 779, 76 [NASA ADS] [CrossRef] [Google Scholar]
All Figures
|
Fig. 1 Left: reconstructed VRHα color image of ESO 338 as seen by MUSE. The Hα image is not continuum subtracted. The black asterisks mark the location of the two foreground stars. The white box shows the region displayed in the panel to the right. Right: reconstructed three-color images based on narrow-band images taken with HST of Lyα (blue), [O iii] λ5007 Å (green) and Hα (red). |
| In the text | |
|
Fig. 2 Left: velocity map of Hα as derived from a Gaussian fit of the emission line. As systemic velocity we have chosen 2841 km s-1. Overplotted are the contours of the Lyα-continuum subtracted emission (Östlin et al. 2009) with contour levels of 0.3, 0.9 and 2 × 10-19 erg/s/cm2/Å. Right: [S ii]/[O iii] line ratio tracing the ionization parameter throughout the galaxy (Pellegrini et al. 2012). All cells with a flux lower than 1.7 × 10⁻¹⁹ erg/s/cm2/Å, corresponding to a S/N = 20 for the S ii λ6717 Å line, have been removed from the plot. The contours show the Hα velocity map with contours at −15 (dashed), 15, 30, and 45 (solid) km s-1. |
| In the text | |
Current usage metrics show cumulative count of Article Views (full-text article views including HTML views, PDF and ePub downloads, according to the available data) and Abstracts Views on Vision4Press platform.
Data correspond to usage on the plateform after 2015. The current usage metrics is available 48-96 hours after online publication and is updated daily on week days.
Initial download of the metrics may take a while.