Fig. 2
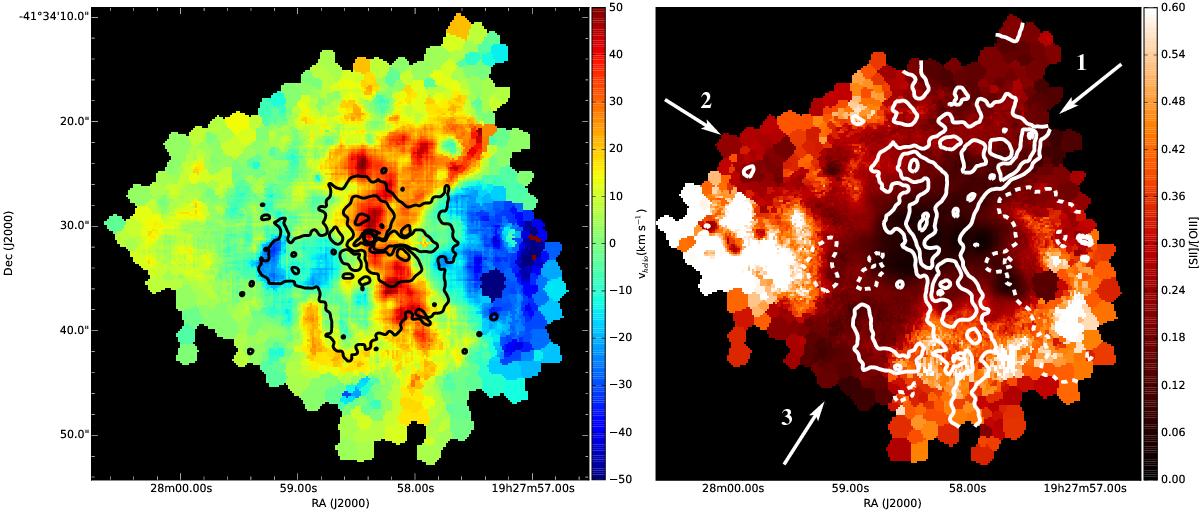
Left: velocity map of Hα as derived from a Gaussian fit of the emission line. As systemic velocity we have chosen 2841 km s-1. Overplotted are the contours of the Lyα-continuum subtracted emission (Östlin et al. 2009) with contour levels of 0.3, 0.9 and 2 × 10-19 erg/s/cm2/Å. Right: [S ii]/[O iii] line ratio tracing the ionization parameter throughout the galaxy (Pellegrini et al. 2012). All cells with a flux lower than 1.7 × 10⁻¹⁹ erg/s/cm2/Å, corresponding to a S/N = 20 for the S ii λ6717 Å line, have been removed from the plot. The contours show the Hα velocity map with contours at −15 (dashed), 15, 30, and 45 (solid) km s-1.
Current usage metrics show cumulative count of Article Views (full-text article views including HTML views, PDF and ePub downloads, according to the available data) and Abstracts Views on Vision4Press platform.
Data correspond to usage on the plateform after 2015. The current usage metrics is available 48-96 hours after online publication and is updated daily on week days.
Initial download of the metrics may take a while.