Fig. 8
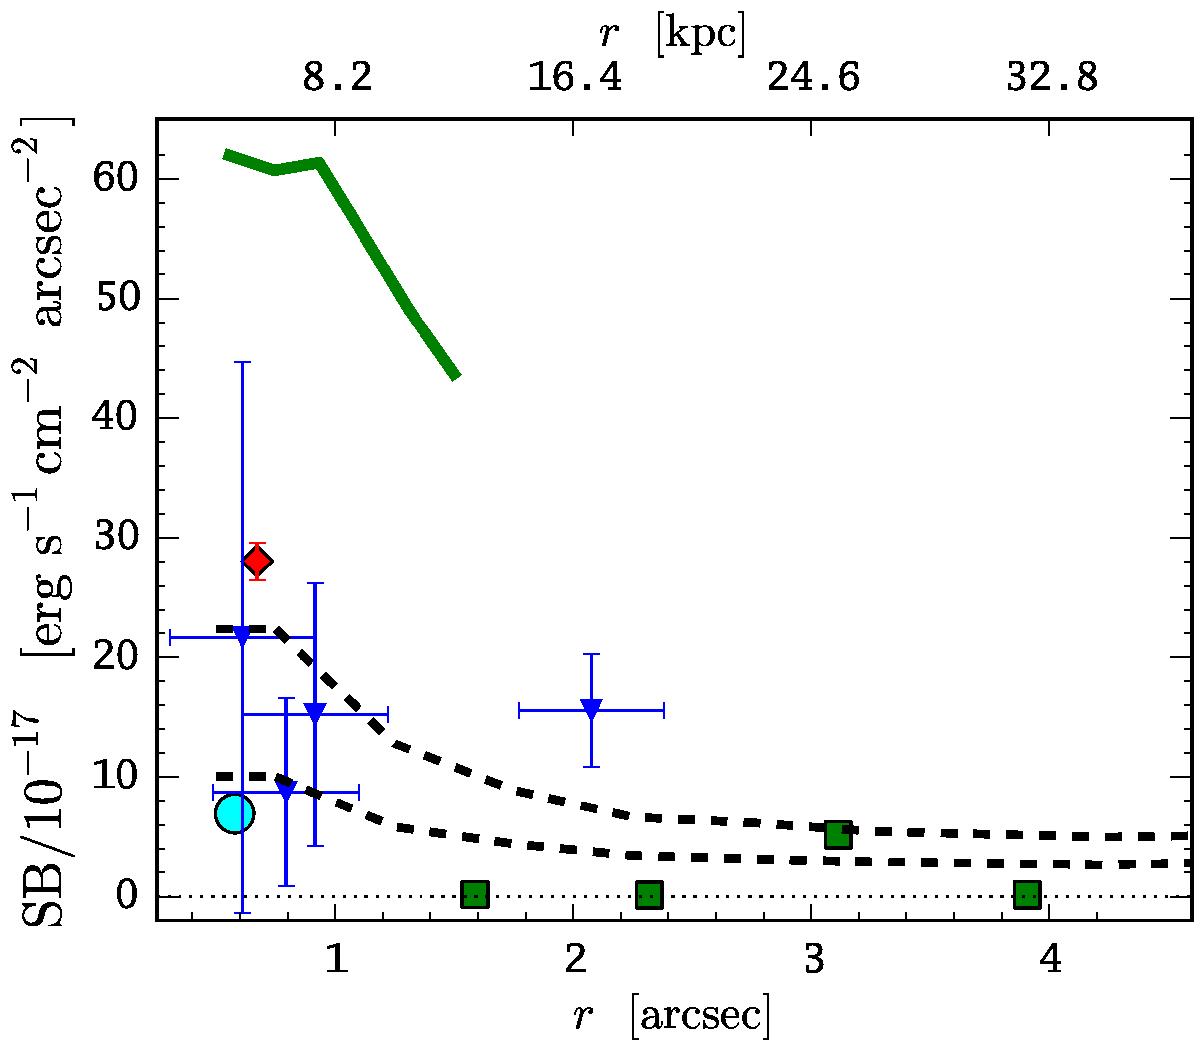
Comparison of our surface brightness upper limits as a function of radius (thick dashed lines) to the reported literature detections of circum-quasar Lyα emission, de-redshifted to z = 2.3, and assuming that the reported maximum extent defines the radius of the detection aperture. The symbols feature results from the CJW06 sample (blue triangles with error bars), from the North et al. (2012) sample (green squares), the nebula from Goto et al. (2012; red diamond) and the fuzz from Francis & McDonnell (2006; cyan circle). We also show the integrated signal at various radii from the de-redshifted Weidinger et al. (2005) surface brightness profile (solid green line).
Current usage metrics show cumulative count of Article Views (full-text article views including HTML views, PDF and ePub downloads, according to the available data) and Abstracts Views on Vision4Press platform.
Data correspond to usage on the plateform after 2015. The current usage metrics is available 48-96 hours after online publication and is updated daily on week days.
Initial download of the metrics may take a while.