| Issue |
A&A
Volume 576, April 2015
|
|
|---|---|---|
| Article Number | L7 | |
| Number of page(s) | 4 | |
| Section | Letters | |
| DOI | https://doi.org/10.1051/0004-6361/201425532 | |
| Published online | 23 March 2015 | |
Stellar mass to halo mass relation from galaxy clustering in VUDS: a high star formation efficiency at z ≃ 3⋆
1 Aix Marseille Université, CNRS, LAM (Laboratoire d’Astrophysique de Marseille) UMR 7326, 13388 Marseille, France
e-mail: anna.durkalec@lam.fr
2 INAF–Osservatorio Astronomico di Bologna, via Ranzani,1, 40127 Bologna, Italy
3 INAF–IASF, via Bassini 15, 20133 Milano, Italy
4 INAF–Osservatorio Astronomico di Roma, via di Frascati 33, 00040 Monte Porzio Catone, Italy
5 University of Bologna, Department of Physics and Astronomy (DIFA), V.le Berti Pichat 6/2, 40127 Bologna, Italy
6 INAF–IASF Bologna, via Gobetti 101, 40129 Bologna, Italy
7 Institut d’Astrophysique de Paris, UMR7095 CNRS, Université Pierre et Marie Curie, 98bis Boulevard Arago, Paris, France
8 Institut de Recherche en Astrophysique et Planétologie – IRAP, CNRS, Université de Toulouse, UPS-OMP, 14 avenue E. Belin, 31400 Toulouse, France
9 Department of Astronomy, University of Geneva, ch. d’Écogia 16, 1290 Versoix, Switzerland
10 Geneva Observatory, University of Geneva, ch. des Maillettes 51, 1290 Versoix, Switzerland
11 Centro de Estudios de Física del Cosmos de Aragón, 44001 Teruel, Spain
12 Department of Astronomy, California Institute of Technology, 1200 E. California Blvd., MC 249–17, Pasadena, USA
13 Astronomy Department, University of Massachusetts, Amherst, MA 01003, USA
14 Max-Planck-Institut für Extraterrestrische Physik, Postfach 1312, 85741 Garching bei München, Germany
15 Research Center for Space and Cosmic Evolution, Ehime University, Bunkyo-cho 2-5, 790-8577 Matsuyama, Japan
16 SUPA, Institute for Astronomy, University of Edinburgh, Royal Observatory, Edinburgh, EH9 3HJ, UK
17 Space Telescope Science Institute, 3700 San Martin Drive, Baltimore, MD 21218, USA
18 Instituto de Fisica y Astronomia, Facultad de Ciencias, Universidad de Valparaiso, Av. Gran Bretana 1111, Casilla 5030 Valparaiso, Chile
19 Astronomical Observatory of the Jagiellonian University, Orla 171, 30-001 Cracow, Poland
20 National Centre for Nuclear Research, ul. Hoza 69, 00-681 Warszawa, Poland
Received: 17 December 2014
Accepted: 27 February 2015
The relation between the galaxy stellar mass M⋆ and the dark matter halo mass Mh gives important information on the efficiency in forming stars and assembling stellar mass in galaxies. We present measurements of the ratio of stellar mass to halo mass (SMHR) at redshifts 2 < z < 5, obtained from the VIMOS Ultra Deep Survey. We use halo occupation distribution (HOD) modelling of clustering measurements on ~3000 galaxies with spectroscopic redshifts to derive the dark matter halo mass Mh, and spectral energy density fitting over a large set of multi-wavelength data to derive the stellar mass M⋆ and compute the SMHR = M⋆/Mh. We find that the SMHR ranges from 1% to 2.5% for galaxies with M⋆ = 1.3 × 10⁹ M⊙ to M⋆ = 7.4 × 10⁹ M⊙ in DM halos with Mh = 1.3 × 10¹¹ M⊙ to Mh = 3 × 10¹¹ M⊙. We derive the integrated star formation efficiency (ISFE) of these galaxies and find that the star formation efficiency is a moderate 6−9% for lower mass galaxies, while it is relatively high at 16% for galaxies with the median stellar mass of the sample ~ 7 × 10⁹ M⊙. The lower ISFE at lower masses may indicate that some efficient means of suppressing star formation is at work (like SNe feedback), while the high ISFE for the average galaxy at z ~ 3 indicates that these galaxies efficiently build up their stellar mass at a key epoch in the mass assembly process. Based on our results, we propose a possible scenario in which the average massive galaxy at z ~ 3 begins to experience truncation of its star formation within a few million years.
Key words: large-scale structure of Universe / early Universe / galaxies: evolution / methods: statistical
© ESO, 2015
1. Introduction
Understanding processes regulating star formation and mass growth in galaxies along cosmic time remains a key issue of galaxy formation and evolution. In the Lambda-cold dark matter (ΛCDM) model, dark matter (DM) halos grow hierarchically, and galaxies are thought to form via dissipative collapse in the deep potential wells of these DM halos (e.g. White & Rees 1978; Fall & Efstathiou 1980). In this paradigm, cooling processes bring baryons in high-density peaks of the matter density field (haloes), where the conditions for gas fragmentation trigger star formation (Bromm et al. 2009). Current models connecting star formation and stellar mass evolution on the one hand and the formation histories of DM halos on the other hand rely on simplifying assumptions and approximations and need to be amended by observational data to reduce the uncertainties in the modelling process (e.g. Conroy & Wechsler 2009).
The efficiency of assembling baryons into stars is an important ingredient for understanding galaxy formation, but it remains poorly constrained observationally. In recent years, it has been proposed to derive this efficiency comparing DM halo mass with galaxy stellar mass. With the measurement of the characteristic mass of DM host haloes Mh now available from observational data and of stellar mass M⋆ derived from the analysis of the spectral energy distribution of galaxies, coupled to the knowledge of the cosmological density of baryons and DM, the conversion rate from baryons to stellar mass can be inferred.
Several methods have been used to link M⋆ and Mh. One of these methods involves halo occupation models, which provide a description of how galaxies populate their host haloes using galaxy clustering statistics and local density profiles (e.g. Zehavi et al. 2005; Leauthaud et al.2012). An alternative method uses abundance matching to associate galaxies to underlying dark matter structure and sub-structures assuming that the stellar masses or luminosities of the galaxies are tightly connected to the masses of dark matter halos (Conroy et al. 2009; Moster et al.2013). The efficiency with which the galaxies converted baryons into stars is encoded in the relationship between M⋆ and Mh as a function of redshift, which provides a benchmark against which galaxy evolution models can be tested. Using observed stellar mass functions, abundance-matching models have led to the derivation of the stellar mass – halo mass (SMHM) relation, which gives for a given halo mass the ratio of stellar mass to halo mass (SMHR), SMHR = M⋆/Mh. Behroozi et al. (2010) reported that the integrated star formation efficiency (ISFE) at a given halo mass peaks at 10−20% of available baryons for all redshifts from 0 to 4.
The shape of the SMHM is claimed not to evolve much from z = 0 to z = 4, although it may be evolving more significantly at z> 4 (Behroozi et al. 2013; Behroozi & Silk 2015). The SMHR is characterized by a maximum around Mh = 1012 M⊙. The lower efficiency at masses below this value may indicate that supernova feedback might be sufficient to remove gas from the galaxy because the halo gravitational potential is lower (e.g. Silk 2003; Bertone et al. 2005; Béthermin et al. 2013). At higher masses, the decrease in star formation efficiency might be produced when cold streams are replaced by isotropic cooling (e.g. Dekel & Birnboim 2006; Faucher-Giguère et al. 2011) or by some high-energy feedback process like that produced by AGNs.
While this picture is attractive from a theoretical modelling point of view, consistency with observational constraints needs to be further improved. In this Letter we use the VIMOS Ultra Deep Survey (VUDS, Le Fèvre et al.2015) to report on the first measurements of the SMHR derived from the observed clustering of galaxies at 2 <z< 5. Using Mh derived from HOD modelling based on the two-point projected correlation function wp(rp), and M⋆ obtained from spectral energy distribution (SED) fitting computed from ~3000 galaxies we estimate the SMHR for several galaxy samples and compare it to SMHM models. The Letter is organized as follows: we summarize the VUDS data in Sect. 2, the Mh and M⋆ measurements are presented in Sect. 3, we derive the SMHR and the ISFE for several mass bins at z ~ 3 in Sect. 4, and we discuss our results in Sect. 5.
We use a flat ΛCDM cosmological model with Ωm = 0.25 and a Hubble constant H0 = 70 km s-1 Mpc to compute absolute magnitudes and masses.
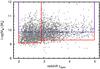 |
Fig. 1 Stellar mass distribution in VUDS. Red lines and horizontal lines indicate the limits in redshift and stellar mass applied to select low- and high-redshift samples. The dashed blue line indicates the mass cut at M⋆ = 7.4 × 10⁹ M⊙ applied to define a high-mass sample. |
Ratio of stellar mass to halo mass (SMHR) and the integrated star formation efficiency (ISFE) in the VUDS survey.
2. VUDS data
The VIMOS Ultra Deep Survey (VUDS) is a spectroscopic survey of ~10 000 galaxies performed with the VIMOS multi-object spectrograph at the European Southern Observatory Very Large Telescope (Le Fèvre et al. 2003). Its main aim is to study early phases of galaxy formation and evolution at 2 <z< 6. Details about the survey strategy, target selection, and data processing and redshift measurements are presented in Le Fèvre et al. (2015).
We use data in the redshift range 2 <z< 5 from two independent fields, COSMOS and VVDS-02h, covering a total area 0.81deg2, corresponding to a volume ~3 × 10⁷ Mpc3. The sample used here contains 3022 galaxies with reliable spectroscopic redshifts (spectroscopy reliability flags 2, 3, 4 and 9, see Le Fèvre et al. 2015) and with a stellar mass in the range 9 < log (M∗) < 11 M⊙ as presented in Fig. 1. The whole sample has been divided into two redshift ranges: 2 <z< 2.9 with  and 2.9 <z< 5.0, for which
 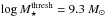 , where
  is the lower mass boundary of the sample resulting from the survey selection function (see below). Additionally, to estimate the SMHR for more massive galaxies, we define a galaxy sub-sample in the range 2 <z< 5 and with log M⋆> 9.87 M⊙. This mass limit is the practical limit for which we can measure a galaxy correlation function signal accurately enough at each observed scale 0.3 <rp< 17 h-1 Mpc, which is required to achieve convergence of the HOD fit.
 |
Fig. 2 Left: the relation between the stellar mass M⋆ and the halo mass Mh in VUDS for different M⋆ and redshifts (red symbols). M⋆ is derived from SED fitting of the multi-wavelength photometric data using known spectroscopic redshifts; error bars in M⋆ indicate expected uncertainties of the SED-fitting method. Mh is obtained from HOD modelling of the two-point correlation function in different redshift and mass ranges. The VUDS data are compared to low- and intermediate-redshift measurements from satellite kinematics (Conroy et al. 2007; More et al. 2011), weak lensing (Mandelbaum et al. 2006), and galaxy clustering (Foucaud et al. 2010). The lines represents model predictions derived from abundance matching at various redshift (Moster et al. 2013). Centre: the ratio of stellar mass M⋆ over halo mass Mh vs. halo mass at z = 3 in the VUDS survey. The colour scheme is the same as for the left panel. Right: evolution of the M⋆/Mh ratio with time predicted from stellar and halo mass accretion histories for the most massive galaxy population observed at z ~ 3, using the toy model described in the text. |
3. M⋆ and Mh measurements
The stellar masses in the VUDS survey were estimated by performing SED fitting on the multi-wavelength photometry using the code Le Phare (Ilbert et al. 2006), as described in detail by Ilbert et al. (2013) and references therein.
Halo masses Mh were measured in a two-step process. First, the projected two-point correlation function wp(rp) was computed for all three sub-samples in Durkalec et al. (2014). The correlation function results were then interpreted in terms of a three-parameter halo occupation model (HOD) of the form proposed by Zehavi et al. (2005) and motivated by Kravtsov et al. (2004), with the mean number of galaxies: 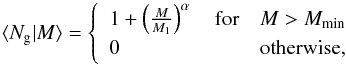 (1)where Mmin is the minimum mass needed for a halo to host one central galaxy, and M1 is the mass of a halo having on average one satellite galaxy, while α is the power-law slope of the satellite mean occupation function.
The correlation function measurements and model-fitting procedures are described in Durkalec et al. (2014). By construction of the halo occupation function given in Eq. (1), the parameter Mmin is the halo mass associated with galaxies with a stellar mass defined as the stellar mass threshold in the SHM relation (Zheng et al. 2005; Zehavi et al. 2005). We therefore quote the lowest mass of the sample considered as , as imposed by the survey limiting magnitude. The errors associated with this lower limit were computed as the average of the errors on M⋆ from the SED fitting for each redshift and mass sub-sample separately.
4. Relation of stellar mass to halo mass at z ~ 3
Our results are presented in Table 1 and in the left panel of Fig. 2. For the low-redshift sample z ~ 2.5 the stellar mass for halos of mass  is
is  , while at z ~ 3.5 the halo mass reaches
  for a stellar mass
  .
.
From these measurements we find that log (M⋆/Mh) ranges from −2.02 ± 0.18 for the low-mass sample to up to −1.6 ± 0.17 for the most massive sample, at redshift z ~ 3. As shown in Fig. 2, these results are compared to various measurements at low and intermediate redshift z < 1, obtained using different methods, including satellite kinematics (Conroy et al. 2007; More et al. 2011), weak lensing (Mandelbaum et al. 2006), galaxy clustering (Foucaud et al. 2010; Hartley et al. 2013), and abundance matching (Moster et al. 2013). Our measurements agree excellently well with models derived from abundance matching at redshift z = 3 (Moster et al. 2013).
5. Discussion and conclusion
Our SMHR measurements are among the first performed at z ~ 3 from a clustering and HOD analysis. These measurements were made possible by the large VUDS spectroscopic redshift survey. The SMHR is 1% to 2.5% for galaxies with intermediate stellar masses (at z ~ 3) ranging from ~109 M⊙ to ~7 × 10⁹ M⊙.
Following Conroy & Wechsler (2009), we computed the ISFE η = M⋆/Mh/fb with fb the universal baryon fraction fb = Ωb/ Ωm = 0.155 (Planck Collaboration XVI 2014). Results are reported in Table 1. The ISFE ranges from 6.2 % to 16.2
 % for galaxies with M⋆ from
  to
to  . The IFSE at z ~ 3 therefore increases with M⋆ over this mass range. The star formation efficiency of ~16% in a halo with Mh = 3 × 10¹¹ M⊙ is quite close to the maximum of ~20% occurring at 1012 M⊙ in SMHM models Behroozi et al. (2010; see also Moster et al. 2013).
We used a simple mass-growth model to derive the time scale for which our most massive galaxy sample would reach the maximum predicted in the SMHM relation from Behroozi et al. (2010). In this model the mass growth of DM haloes is described by a mean accretion rate  taken from Fakhouri et al. (2010), while galaxies grow in M⋆ via star formation using the median SFR for our sample (Tasca et al. 2014a), as well as through mergers with a constant accretion in stars of ~ 1 M⊙/ yr (Tasca et al. 2014b). We computed the halo and stellar mass values every δt = 5 Myr to account for the halo accretion rate and SFR changing with redshift and mass. In the right panel of Fig. 2 we represent the expected time evolution in M⋆/Mh versus M⋆ for a galaxy starting at z ~ 3 following this toy model. The SMHM relation would reach a maximum log (M⋆/Mh) ≃ − 1.25 about 360 Myr after the observed epoch (i.e. at z ~ 2.6), and at this time, halo and stellar masses will be
  and
and  .
.
According to the model proposed by Moster et al. (2013), the SMHM relation is expected to reverse after reaching a maximum, with the slope of the relation maintaining the same absolute value, but reversing sign (see Fig. 2). Since dark matter halos grow with time (e.g. Fakhouri et al. 2010), the growth in stellar mass must drop dramatically over a sustained period of time to follow a change in M⋆/Mh by roughly an order of magnitude in the SMHM, or, alternatively, the dark matter accretion rate  must rise precipitously, or a combination of the two. There are no indications in N-body simulations, for example, that would support a dramatic sustained rise in
  . On the other hand, the stellar mass computed at the maximum of the SMHM relation is M⋆ ~ 2 × 10¹⁰ M⊙, comparable to the “quenching mass” discussed in Bundy et al. (2006), and this is massive enough at z ~ 2.6 that mass-related quenching may be dominant (Peng et al. 2010). The confluence of this evidence suggests that the abatement of stellar mass growth and not a rapid acceleration of causes the SMHM behaviour near its peak. While the concordance of the evolved mean stellar mass of our sample with populations that are thought to be undergoing quenching makes it tempting to link the two, it is sufficient for our purposes that the star formation in the average z ~ 3 VUDS galaxy with
  begins to be truncated, either by active quenching or more gentle processes, within a few hundred million years. We estimate that this truncation, which ends when the average SFR drops effectively to zero, takes place over ~2 Gyr to fit the observed behaviour of the SMHM relation (i.e., the time it takes MH to grow by 0.5 dex), with further stellar mass growth allowed only slowly through mergers or residual low-level star formation events, for instance.
In conclusion, the SMHM is a simple yet efficient tool for probing star formation efficiency at the epoch of rapid stellar mass assembly, provided one obtains robust measurements on both M⋆ and Mh; this is now possible with VUDS at z ~ 3, which complements more indirect estimates that use abundance matching, for example. A more extensive exploration of the efficiency of star formation over a wider range of halo masses is becoming possible with new surveys, and it would be interesting to probe higher masses than done in this paper to evaluate the halo mass corresponding to the highest star formation efficiency. Extending such measurements to higher redshifts will require the power of new facilities such as PFS-Sumire, JWST, or ELTs.
Acknowledgments
We thank Jean Coupon and Carlo Schimd for interesting discussions. This work is supported by the European Research Council Advanced Grant ERC-2010-AdG-268107-EARLY, and by INAF Grants PRIN 2010&2012 and PICS 2013. A.C., O.C., M.T. and V.S. acknowledge the grant MIUR PRIN 2010–2011. This work is supported by the OCEVU Labex (ANR-11-LABX-0060) and the A*MIDEX project (ANR-11-IDEX-0001-02). A.P. is supported by grant UMO-2012/07/B/ST9/04425 and the Polish-Swiss Astro Project. Research conducted within the scope of the HECOLS International Associated Laboratory, supported in part by the Polish NCN grant Dec-2013/08/M/ST9/00664. This work is based on data products made available at the CESAM data center, Laboratoire d’Astrophysique de Marseille, France.
References
- Behroozi, P. S., & Silk, J. 2015, ApJ, 799, 32 [NASA ADS] [CrossRef] [Google Scholar]
- Behroozi, P. S., Conroy, C., & Wechsler, R. H. 2010, ApJ, 717, 379 [NASA ADS] [CrossRef] [Google Scholar]
- Behroozi, P. S., Wechsler, R. H., & Conroy, C. 2013, ApJ, 762, L31 [NASA ADS] [CrossRef] [Google Scholar]
- Bertone, S., Stoehr, F., & White, S. D. M. 2005, MNRAS, 359, 1201 [NASA ADS] [CrossRef] [Google Scholar]
- Béthermin, M., Wang, L., Doré, O., et al. 2013, A&A, 557, A66 [NASA ADS] [CrossRef] [EDP Sciences] [Google Scholar]
- Bromm, V., Yoshida, N., Hernquist, L., & McKee, C. F. 2009, Nature, 459, 49 [NASA ADS] [CrossRef] [PubMed] [Google Scholar]
- Bundy, K., Ellis, R. S., Conselice, C. J., et al. 2006, ApJ, 651, 120 [NASA ADS] [CrossRef] [Google Scholar]
- Conroy, C., & Wechsler, R. H. 2009, ApJ, 696, 620 [NASA ADS] [CrossRef] [Google Scholar]
- Conroy, C., Prada, F., Newman, J. A., et al. 2007, ApJ, 654, 153 [NASA ADS] [CrossRef] [Google Scholar]
- Conroy, C., Gunn, J. E., & White, M. 2009, ApJ, 699, 486 [NASA ADS] [CrossRef] [Google Scholar]
- Dekel, A., & Birnboim, Y. 2006, MNRAS, 368, 2 [NASA ADS] [CrossRef] [Google Scholar]
- Durkalec, A., Le Fèvre, O., Pollo, A., et al. 2014, A&A, submitted [arXiv:1411.5688] [Google Scholar]
- Fakhouri, O., Ma, C.-P., & Boylan-Kolchin, M. 2010, MNRAS, 406, 2267 [NASA ADS] [CrossRef] [Google Scholar]
- Fall, S. M., & Efstathiou, G. 1980, MNRAS, 193, 189 [NASA ADS] [CrossRef] [Google Scholar]
- Faucher-Giguère, C.-A., Kereš, D., & Ma, C.-P. 2011, MNRAS, 417, 2982 [NASA ADS] [CrossRef] [Google Scholar]
- Foucaud, S., Conselice, C. J., Hartley, W. G., et al. 2010, MNRAS, 406, 147 [NASA ADS] [CrossRef] [Google Scholar]
- Hartley, W. G., Almaini, O., Mortlock, A., et al. 2013, MNRAS, 431, 3045 [NASA ADS] [CrossRef] [Google Scholar]
- Ilbert, O., Arnouts, S., McCracken, H. J., et al. 2006, A&A, 457, 841 [NASA ADS] [CrossRef] [EDP Sciences] [Google Scholar]
- Ilbert, O., McCracken, H. J., Le Fèvre, O., et al. 2013, A&A, 556, A55 [NASA ADS] [CrossRef] [EDP Sciences] [Google Scholar]
- Kravtsov, A. V., Berlind, A. A., Wechsler, R. H., et al. 2004, ApJ, 609, 35 [NASA ADS] [CrossRef] [Google Scholar]
- Le Fèvre, O., Saisse, M., Mancini, D., et al. 2003, in Instrument Design and Performance for Optical/Infrared Ground-based Telescopes, eds. M. Iye, & A. F. M. Moorwood, SPIE Conf. Ser., 4841, 1670 [Google Scholar]
- Le Fèvre, O., Tasca, L. A. M., Cassata, P., et al. 2015, A&A, in press, DOI: 10.1051/0004-6361/201423829 [Google Scholar]
- Leauthaud, A., Tinker, J., Bundy, K., et al. 2012, ApJ, 744, 159 [NASA ADS] [CrossRef] [Google Scholar]
- Mandelbaum, R., Seljak, U., Kauffmann, G., Hirata, C. M., & Brinkmann, J. 2006, MNRAS, 368, 715 [Google Scholar]
- More, S., van den Bosch, F. C., Cacciato, M., et al. 2011, MNRAS, 410, 210 [NASA ADS] [CrossRef] [Google Scholar]
- Moster, B. P., Naab, T., & White, S. D. M. 2013, MNRAS, 428, 3121 [NASA ADS] [CrossRef] [Google Scholar]
- Peng, Y.-j., Lilly, S. J., Kovač, K., et al. 2010, ApJ, 721, 193 [NASA ADS] [CrossRef] [Google Scholar]
- Planck Collaboration XVI. 2014, A&A, 571, A16 [NASA ADS] [CrossRef] [EDP Sciences] [Google Scholar]
- Silk, J. 2003, MNRAS, 343, 249 [NASA ADS] [CrossRef] [MathSciNet] [Google Scholar]
- Tasca, L. A. M., Le Fèvre, O., Hathi, N. P., et al. 2014a, A&A, submitted [arXiv:1411.5687] [Google Scholar]
- Tasca, L. A. M., Le Fèvre, O., López-Sanjuan, C., et al. 2014b, A&A, 565, A10 [NASA ADS] [CrossRef] [EDP Sciences] [Google Scholar]
- White, S. D. M., & Rees, M. J. 1978, MNRAS, 183, 341 [NASA ADS] [CrossRef] [Google Scholar]
- Zehavi, I., Zheng, Z., Weinberg, D. H., et al. 2005, ApJ, 630, 1 [Google Scholar]
- Zheng, Z., Berlind, A. A., Weinberg, D. H., et al. 2005, ApJ, 633, 791 [NASA ADS] [CrossRef] [Google Scholar]
All Tables
Ratio of stellar mass to halo mass (SMHR) and the integrated star formation efficiency (ISFE) in the VUDS survey.
All Figures
|
Fig. 1 Stellar mass distribution in VUDS. Red lines and horizontal lines indicate the limits in redshift and stellar mass applied to select low- and high-redshift samples. The dashed blue line indicates the mass cut at M⋆ = 7.4 × 10⁹ M⊙ applied to define a high-mass sample. |
| In the text | |
|
Fig. 2 Left: the relation between the stellar mass M⋆ and the halo mass Mh in VUDS for different M⋆ and redshifts (red symbols). M⋆ is derived from SED fitting of the multi-wavelength photometric data using known spectroscopic redshifts; error bars in M⋆ indicate expected uncertainties of the SED-fitting method. Mh is obtained from HOD modelling of the two-point correlation function in different redshift and mass ranges. The VUDS data are compared to low- and intermediate-redshift measurements from satellite kinematics (Conroy et al. 2007; More et al. 2011), weak lensing (Mandelbaum et al. 2006), and galaxy clustering (Foucaud et al. 2010). The lines represents model predictions derived from abundance matching at various redshift (Moster et al. 2013). Centre: the ratio of stellar mass M⋆ over halo mass Mh vs. halo mass at z = 3 in the VUDS survey. The colour scheme is the same as for the left panel. Right: evolution of the M⋆/Mh ratio with time predicted from stellar and halo mass accretion histories for the most massive galaxy population observed at z ~ 3, using the toy model described in the text. |
| In the text | |
Current usage metrics show cumulative count of Article Views (full-text article views including HTML views, PDF and ePub downloads, according to the available data) and Abstracts Views on Vision4Press platform.
Data correspond to usage on the plateform after 2015. The current usage metrics is available 48-96 hours after online publication and is updated daily on week days.
Initial download of the metrics may take a while.