Fig. 2
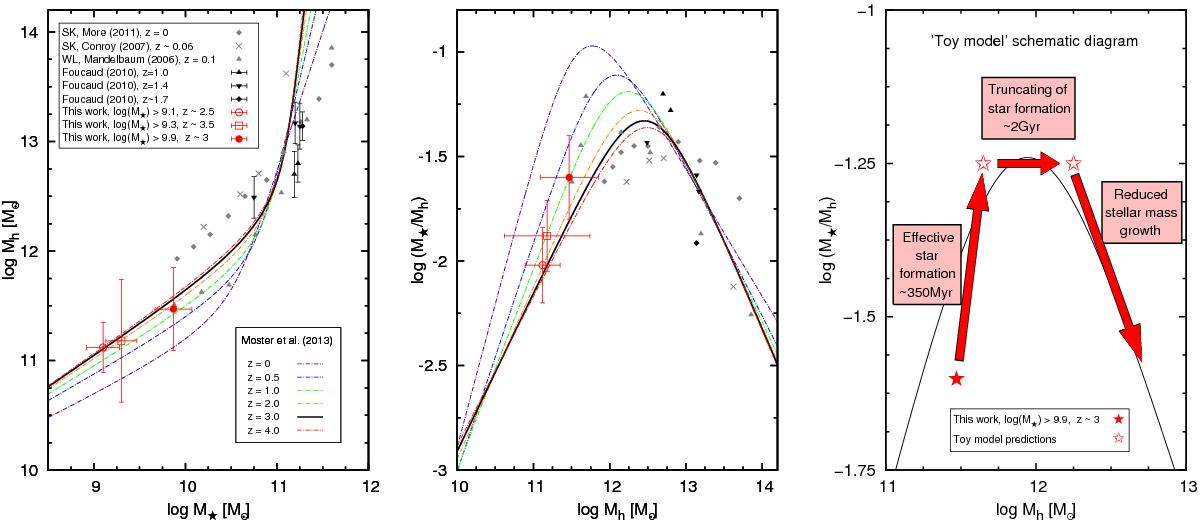
Left: the relation between the stellar mass M⋆ and the halo mass Mh in VUDS for different M⋆ and redshifts (red symbols). M⋆ is derived from SED fitting of the multi-wavelength photometric data using known spectroscopic redshifts; error bars in M⋆ indicate expected uncertainties of the SED-fitting method. Mh is obtained from HOD modelling of the two-point correlation function in different redshift and mass ranges. The VUDS data are compared to low- and intermediate-redshift measurements from satellite kinematics (Conroy et al. 2007; More et al. 2011), weak lensing (Mandelbaum et al. 2006), and galaxy clustering (Foucaud et al. 2010). The lines represents model predictions derived from abundance matching at various redshift (Moster et al. 2013). Centre: the ratio of stellar mass M⋆ over halo mass Mh vs. halo mass at z = 3 in the VUDS survey. The colour scheme is the same as for the left panel. Right: evolution of the M⋆/Mh ratio with time predicted from stellar and halo mass accretion histories for the most massive galaxy population observed at z ~ 3, using the toy model described in the text.
Current usage metrics show cumulative count of Article Views (full-text article views including HTML views, PDF and ePub downloads, according to the available data) and Abstracts Views on Vision4Press platform.
Data correspond to usage on the plateform after 2015. The current usage metrics is available 48-96 hours after online publication and is updated daily on week days.
Initial download of the metrics may take a while.