| Issue |
A&A
Volume 576, April 2015
|
|
|---|---|---|
| Article Number | A5 | |
| Number of page(s) | 10 | |
| Section | Interstellar and circumstellar matter | |
| DOI | https://doi.org/10.1051/0004-6361/201425484 | |
| Published online | 13 March 2015 | |
Detection of glycolaldehyde toward the solar-type protostar NGC 1333 IRAS2A⋆,⋆⋆
1 Centre for Star and Planet Formation, Niels Bohr Institute and Natural History Museum of Denmark, University of Copenhagen, Øster Voldgade 5–7, 1350 Copenhagen K, Denmark
e-mail: This email address is being protected from spambots. You need JavaScript enabled to view it.
2 Leiden Observatory, Leiden University, PO Box 9513, 2300 RA Leiden, The Netherlands
Received: 8 December 2014
Accepted: 30 January 2015
Abstract
Glycolaldehyde is a key molecule in the formation of biologically relevant molecules such as ribose. We report its detection with the Plateau de Bure interferometer toward the Class 0 young stellar object NGC 1333 IRAS2A, which is only the second solar-type protostar for which this prebiotic molecule is detected. Local thermodynamic equilibrium analyses of glycolaldehyde, ethylene glycol (the reduced alcohol of glycolaldehyde), and methyl formate (the most abundant isomer of glycolaldehyde) were carried out. The relative abundance of ethylene glycol to glycolaldehyde is found to be ~5 – higher than in the Class 0 source IRAS 16293-2422 (~1), but similar to the lower limits derived in comets (≥3–6). The different ethylene glycol-to-glycolaldehyde ratios in the two protostars might be related to different CH3OH:CO compositions of the icy grain mantles. In particular, a more efficient hydrogenation on the grains in NGC 1333 IRAS2A would favor the formation of both methanol and ethylene glycol. In conclusion, it is possible that like NGC 1333 IRAS2A, other low-mass protostars show high ethylene glycol-to-glycolaldehyde abundance ratios. The cometary ratios might consequently be inherited from earlier stages of star formation if the young Sun experienced conditions similar to NGC 1333 IRAS2A.
Key words: astrochemistry / astrobiology / ISM: individual objects: NGC 1333 IRAS2A / stars: formation / stars: protostars / ISM: molecules
Based on observations carried out with the IRAM Plateau de Bure Interferometer. IRAM is supported by INSU/CNRS (France), MPG (Germany) and IGN (Spain).
Figures 3–4 and Table 1 are available in electronic form at http://www.aanda.org
© ESO, 2015
1. Introduction
The inner regions of low-mass protostars are known to harbor a rich complex organic chemistry characterized by the presence of molecules such as methyl formate (CH3OCHO), dimethyl ether (CH3OCH3), and ethyl cyanide (C2H5CN) (e.g., Cazaux et al. 2003; Bottinelli et al. 2004a; Bisschop et al. 2008). To distinguish them from the hot cores present in high-mass star-forming regions, they were called hot corinos (Ceccarelli 2004; Bottinelli et al. 2004b). These complex organic molecules are thought to be efficiently formed on grains and then released into the gas phase in the hot corino by thermal desorption (e.g., Garrod et al. 2008; Herbst & van Dishoeck 2009). Some of these complex organic molecules are particularly interesting because of their supposed role in the emergence of life. Indeed, the detection of so-called prebiotic molecules in low-mass star-forming regions indicates that they can form early during the star formation process and thereby be available for possible later incorporation into solar system bodies, for instance, into comets.
Glycolaldehyde (CH2OHCHO) is one of these prebiotic molecules: it is a simple sugar-like molecule and under Earth-like conditions is the first product in the formose reaction leading to the formation of ribose, an essential constituent of ribonucleic acid (RNA) (e.g., Zubay & Mui 2001; Jalbout et al. 2007). Glycolaldehyde was first detected toward the Galactic center (Sgr B2(N): Hollis et al. 2000, 2001, 2004; Halfen et al. 2006; Belloche et al. 2013; molecular clouds: Requena-Torres et al. 2008). Later it was shown to be present in the high-mass star-forming region G31.41+0.31 (Beltrán et al. 2009), in the intermediate-mass protostar NGC 7129 FIRS 2 (Fuente et al. 2014), and even in the hot corinos of the Class 0 protostellar binary, IRAS 16293-2422 (hereafter IRAS 16293, Jørgensen et al. 2012). This indicates that this molecule can be synthesized relatively early in the environments of solar-type protostars. Furthermore, glycolaldehyde can easily survive during impact delivery to planetary bodies, and impacts can even facilitate the formation of even more complex molecules (McCaffrey et al. 2014).
Similarly to other complex organic molecules, the formation of glycolaldehyde is thought to occur on grains. In particular, a gas-phase formation was excluded by Woods et al. (2012, 2013), as the produced abundances are too low compared with the observations. Several grain surface formation pathways were proposed in the literature. Woods et al. (2012) modeled their efficiency and showed that the formation by the reaction CH3OH + HCO would be very efficient, but that, from chemical considerations, H3CO + HCO could be more feasible. Another probably efficient way to form glycolaldehyde would be through HCO dimerization (HCO + HCO → HOCCOH) followed by two successive hydrogenations (Woods et al. 2013). A recent experimental study based on surface hydrogenations of CO seems to confirm this pathway (Fedoseev et al. 2015).
A species related to this prebiotic molecule is ethylene glycol ((CH2OH)2). More commonly known as antifreeze, it is the reduced alcohol of glycolaldehyde. This molecule was tentatively detected toward IRAS 16293 with one line of the gGg′ conformer (Jørgensen et al. 2012). Interestingly, the aGg′ conformer of ethylene glycol (the conformer of lowest energy) was detected in three comets, Hale-Bopp, Lemmon, and Lovejoy, while glycolaldehyde was not, leading to a lower limit of 3–6 for the (CH2OH)2/CH2OHCHO abundance ratio (Crovisier et al. 2004; Biver et al. 2014). Ethylene glycol was also detected in the Murchison and Murray carbonaceous meteorites, while the presence of aldehyde sugars have not been reported yet (Cooper et al. 2001).
NGC 1333 IRAS2A (hereafter IRAS2A) is another of these famous hot corinos. In particular, methyl formate, the most abundant isomer of glycolaldehyde, was detected toward this source by Jørgensen et al. (2005a) and Bottinelli et al. (2007). More recently, ethylene glycol was detected in the framework of the CALYPSO program carried out with the IRAM Plateau de Bure Interferometer (PdBI) by Maury et al. (2014). We here report the detection of glycolaldehyde toward the same low-mass protostar and present an analysis of the relative abundances of these three species.
2. Observations
This work is based on several separate programs carrying out observations of the solar-type protostar IRAS2A with the PdBI. Four spectral ranges (84.9−88.5, 223.5−227.1, 240.2−243.8, and 315.5−319.1 GHz) were covered with the WIDEX correlator at a spectral resolution of 1.95 MHz (dν= 6.8 km s-1 at 86 GHz, dν= 2.6 km s-1 at 225 GHz, dν= 2.4 km s-1 at 242 GHz, dν= 1.8 km s-1 at 317 GHz) and reduced with the GILDAS1 software. The synthetized beam sizes obtained with natural weighting are about 3.0″ × 3.0″ at 86 GHz, 1.2″ × 1.0″ at 225 GHz, 1.4″ × 1.0″ at 242 GHz, and 0.9″ × 0.8″ at 317 GHz. The dust continuum fluxes at 0.9 and 1.3 mm are consistent with previous measurements (e.g., Jørgensen et al. 2007; Persson et al. 2012). The absolute calibration uncertainty for each dataset is about 20%. Additional information about the observations and their reduction can be found in Coutens et al. (2014) and Persson et al. (2014). The 3 mm data are from Wampfler (priv. comm.).
Using the CASSIS2 software, we detected 8 lines of glycolaldehyde, 31 lines of the aGg′ conformer of ethylene glycol, and 26 lines of methyl formate (see Table 1). The glycolaldehyde and methyl formate transitions are taken from the JPL spectroscopic database (Pickett et al. 1998), while the ethylene glycol transitions are from the CDMS catalog (Müller et al. 2001, 2005). The predictions are based on experimental data from Butler et al. (2001), Widicus Weaver et al. (2005) and Carroll et al. (2010) for glycolaldehyde, Christen et al. (1995) and Christen & Müller (2003) for ethylene glycol, and Ilyushin et al. (2009) for methyl formate. The frequencies of five of the detected glycolaldehyde lines were directly measured in the laboratory (Butler et al. 2001). Some of the lines result from a blending of several transitions of the same species. The lines that are strongly blended with other species are not listed in Table 1. All three species are emitted very compactly at the position of the continuum peak ( ,
,  ). The angular sizes obtained with a circular Gaussian fit in the (u, ν) plane vary from a point source to a maximum of 1″ depending on the transition. The line fluxes listed in Table 1 were measured at the continuum peak position with the CASSIS software using a Gaussian fitting method (Levenberg-Marquardt algorithm). The lines that are contaminated in the wings by other transitions are consequently fitted with a sum of Gaussians. We carefully checked that the derived full widths at half maximum (FWHM) are consistent with the other line measurements. The average FWHM is about 4.5 km s-1 at 317 GHz, and 5.0 km s-1 at 225 and 242 GHz. The widths of the methyl formate lines at 87 GHz are quite broad (~12 km s-1). It is consequently difficult to completely exclude an additional flux contribution from other species. The variation of FWHM with the frequency can be explained by the spectral resolution of the observations that decreases toward the lower frequencies.
3. Results
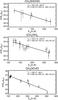 |
Fig. 1 Rotational diagrams for glycolaldehyde, ethylene glycol, and methyl formate. |
We carried out a local thermodynamic equilibrium analysis of the three species through the rotational diagram method (Goldsmith & Langer 1999). We considered that the lines are emitted in a region of 0.5″ size, which is the average size derived for the methyl formate lines when fitting circular Gaussians in the (u, ν) plane (see also Maury et al. 2014). It is also similar to what we found for deuterated water (Coutens et al. 2014). It also corresponds to the expected size of the region where the temperature increases above ~100 K according to dust radiation transfer models of the envelope (Jørgensen et al. 2002) and where the complex molecules and deuterated water should sublimate from the grains. The line fluxes that result from a combination of several transitions of the same species are used in the rotational diagrams unless the transitions have different Eup values. For glycolaldehyde, we include two lines that are slightly blended with some methyl formate transitions after subtracting the predicted flux contribution from methyl formate. As the best-fit model for methyl formate reproduces the observations extremely well, the final fluxes of the glycolaldehyde lines can be trusted, which is also confirmed by their alignment with the other points in the rotational diagram of glycolaldehyde (see upper panel in Fig. 1). Assuming a source size of 0.5″, we derive column densities (with 1σ uncertainties) of 2.4 cm-2, 1.3
 cm-2, and 4.8
 cm-2, and excitation temperatures of 103
 K, 133
 K, and 126
 K for glycolaldehyde, ethylene glycol, and methyl formate, respectively. Within the uncertainty range, the excitation temperature seems to be similar between the three species (~130 K), which is consistent if the three species arise from a same region. We verified for each species that there is no line flux overpredicted by the model anywhere in the four datasets. For ethylene glycol, the model shows an overproduced flux for some transitions, especially the lines (240.778, 241.545, 241.860, and 316.444 GHz) that correspond to the four lower points in the rotational diagram (see middle panel in Fig. 1). A model with a column density of 1.1 × 1016 cm-2 would be sufficient to produce line fluxes consistent with these observations. Table 2 summarizes the parameters used for the line modeling of the three species that can be seen in Figs. 2–4. According to these models, all lines are optically thin (τ ≤ 0.1).
Parameters used to compute the synthetic spectra of glycolaldehyde, ethylene glycol, and methyl formate.
Although no species other than glycolaldehyde is found at a frequency of 240 890.5 MHz, the line (Eup = 52 K) is probably blended with an unidentified species: the predicted flux is completely underproduced with respect to the observations, and this cannot be due to a different excitation in the cold gas, as a line of glycolaldehyde at 243 232.21 MHz (Eup = 47 K) – blended with a bright CH2DOH line in the redshifted part of the spectrum and also potentially blended with a DCOOH line (Eup = 106 K, Aij = 1.35 × 10⁻⁴ s-1) – would have a higher flux inconsistent with the observed one.
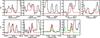 |
Fig. 2 Observed lines of CH2OHCHO toward the protostar NGC 1333 IRAS2A (in black). The best-fit model for CH2OHCHO (see Table 2) is shown as red solid lines. The line in the third upper panel is blended with an unidentified species. The contribution of the CH3OCHO lines is indicated with green lines, and the model including both CH2OHCHO and CH3OCHO can be seen as red dotted lines. |
(CH2OH)2/CH2OHCHO, CH3OCHO/CH2OHCHO, and CH3OCHO/(CH2OH)2 column density ratios determined in different objects.
4. Discussion
The relative abundances of the three species are derived from the column densities in Table 2 and are compared with other star-forming regions and comets in Table 3. The (CH2OH)2/CH2OHCHO abundance ratio of ~0.3–0.5 previously derived in IRAS 16293 by Jørgensen et al. (2012) was revised. Indeed, the assignment in Jørgensen et al. (2012) was based on only one line of the gGg′ conformer of ethylene glycol about 200 cm-1 (~290 K, Müller & Christen 2004) above the lowest-energy aGg′ conformer – and thus tentative. An analysis from observations of six transitions of the lower energy conformer from ALMA Cycle 1 observations at 3 mm (four spectral windows at 89.48–89.73, 92.77–93.03, 102.48–102.73, and 103.18–103.42 GHz; Jørgensen et al., in prep.) results in a higher ethylene glycol-to-glycolaldehyde abundance ratio of 1.0 ± 0.3. This new estimate is consistent with the ratio expected between the aGg′ and gGg′ conformers under thermal equilibrium conditions at 300 K, the excitation temperature of glycolaldehyde derived in IRAS 16293 (Jørgensen et al. 2012). The (CH2OH)2/CH2OHCHO abundance ratio in IRAS2A is estimated at 5.5 ± 1.0 if we consider the column densities derived from the rotational diagrams. It is slightly lower (4.6), however, if we use the column density of ethylene glycol of 1.1 × 1016 cm-2 that does not overproduce the peak intensities of a few lines (see Fig. 3). The (CH2OH)2/CH2OHCHO abundance ratio consequently is a factor ~5 higher than in the Class 0 protostar IRAS 16293. It is also higher than in the other star-forming regions (see Table 3), but similar to the lower limits derived in comets (≳3–6). This indicates that the glycolaldehyde chemistry may in general vary among hot corinos. It is possible that like IRAS2A, other very young low-mass protostars show high (CH2OH)2/CH2OHCHO abundance ratios, in agreement with the cometary values. The CH3OCHO/CH2OHCHO column density ratio found in IRAS2A (~20) ranges between the values derived in the molecular clouds from the Galactic center (~3.3–5.2) and the high-mass star-forming regions (~40–52). A lower limit of 2 was derived for comet Hale-Bopp.
In contrast to IRAS 16293, the (CH2OH)2/CH2OHCHO abundance ratio in IRAS2A is comparable to the lower limits in comets. To explain these different abundance ratios in IRAS2A and IRAS 16293, two scenarios are possible: either the (CH2OH)2/CH2OHCHO ratio is similar in the grain mantles of low-mass protostars and evolves in the gas phase after the sublimation of the molecules in the hot corinos, or this ratio was already different in the grain mantles of the two protostars.
In the first scenario, if we assume that the (CH2OH)2/ CH2OHCHO increases until it reaches the cometary value, it would mean that glycolaldehyde can easily be destroyed in the gas phase of the warm inner regions. Another possibility would be that ethylene glycol can form efficiently in the gas phase, but complex organic molecules are generally difficult to form with high abundances in the gas phase. If the evaporation temperature of ethylene glycol is higher than glycolaldehyde, as assumed in the chemical model of Garrod (2013), ethylene glycol would desorb later than glycolaldehyde, and the (CH2OH)2/CH2OHCHO abundance ratio would consequently increase with time (until the two molecules have completely desorbed). This chemical model predicts an abundance of glycolaldehyde significantly higher than those of ethylene glycol and methyl formate, however, which is inconsistent with the ratios derived in IRAS2A. More theoretical and experimental work would be needed to make the case that these hypotheses are plausible.
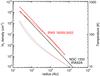 |
Fig. 5 Black: H2 density (solid line) and temperature (dotted line) profiles of the protostar IRAS2A from Jørgensen et al. (2002). Red: H2 density (solid line: power-law model, dashed line: Shu-like model) and temperature (dotted line) profiles of the protostar IRAS 16293 from Crimier et al. (2010). |
In contrast, experimental studies based on irradiation of ices show that the second scenario is likely. Such studies show that glycolaldehyde, ethylene glycol, and methyl formate can be synthesized by irradiation of pure or mixed methanol (CH3OH) ices (Hudson & Moore 2000; Öberg et al. 2009). Interestingly, the (CH2OH)2/CH2OHCHO abundance ratio is found to be dependent on the initial ice composition as well as on the ice temperature during the UV irradiation. The CH3OH:CO ratio in the ices is a key parameter: for irradiated 20 K ices a composition of pure CH3OH leads to a (CH2OH)2/CH2OHCHO ratio higher than 10, while a CH3OH:CO 1:10 ice mixture produces a (CH2OH)2/CH2OHCHO ratio lower than 0.25 (Öberg et al. 2009). The difference found between IRAS 16293 and IRAS2A could then be related to a different grain mantle composition in the two sources. If the CH3OH:CO ratio in the grain mantles of IRAS2A was higher than in IRAS 16293, a higher (CH2OH)2/CH2OHCHO abundance ratio would be expected according to the laboratory results. In fact, the CH3OH gas-phase abundance in the inner envelope is found to be higher in IRAS2A (~4 × 10⁻⁷, Jørgensen et al. 2005b) than in IRAS 16293 (~1 × 10⁻⁷, Schöier et al. 2002), while the CO abundance is relatively similar (~(2–3) × 10-5, Jørgensen et al. 2002; Schöier et al. 2002). This could consequently be the result of the desorption of ices with a higher CH3OH:CO ratio in IRAS2A than IRAS 16293. The question then arises of how CH3OH can be more efficiently produced on grains in IRAS2A than in IRAS 16293. Several scenarios are possible: i) the initial conditions may play an important role in the CH3OH:CO ratio. In particular, experiments and simulations show that the efficiency of CH3OH formation through CO hydrogenation on the grains is dependent on temperature, ice composition (CO:H2O), and time (Watanabe et al. 2004; Fuchs et al. 2009); ii) the collapse timescale was longer in IRAS2A than in IRAS 16293, enabling the formation of more CH3OH; iii) the H2 density in the prestellar envelope of IRAS2A was lower than that of IRAS 16293. A less dense environment would lead to a higher atomic H density and consequently to a higher efficiency of CO hydrogenation. This was proposed by Maret et al. (2004) and Bottinelli et al. (2007) to explain the anticorrelation found between the inner abundances of H2CO and CH3OH and the ratios of submillimeter to bolometric luminosity (Lsmm/Lbol) of different low-mass protostars. The Lsmm/Lbol parameter is interpreted as an indication of different initial conditions, rather than an evolutionary parameter in this context (Maret et al. 2004). The Lsmm/Lbol ratios of IRAS2A (~0.005, Karska et al. 2013) and IRAS 16293 (~0.019, Froebrich 2005) are consistent with this hypothesis. The current H2 density profiles of these two sources also agree with this scenario if they keep the memory of the prestellar conditions. The density derived in the outer envelope of IRAS2A with a power-law model (Jørgensen et al. 2002) is lower than the density derived in IRAS 16293 by Crimier et al. (2010), whether it be for a Shu-like model or a power-law model, while the temperature profiles are relatively similar (see Fig. 5). Along the same lines, Hudson et al. (2005) showed with proton irradiation experiments that glycolaldehyde is more sensitive to radiation damage than ethylene glycol. Irradiation would be more important in less dense envelopes, which would also be consistent with a less dense prestellar envelope in IRAS2A. A recent experiment by Fedoseev et al. (2015) shows that these two species can also be synthesized by surface hydrogenations of CO molecules in dense molecular cloud conditions. They do not directly form from CH3OH, but the results of this experiment show that similarly to CH3OH, which results from successive hydrogenations of CO, ethylene glycol forms by two successive hydrogenations of glycolaldehyde. This consequently agrees with the proposed scenario.
In conclusion, the (CH2OH)2/CH2OHCHO abundance ratio measured in low-mass protostars can be different from one source to another, and possibly consistent with cometary values. In some cases, the (CH2OH)2/CH2OHCHO ratios determined in comets might consequently be inherited from early stages of star formation. This difference between low-mass protostars might be related to a different CH3OH:CO ratio in the grain mantles. A more efficient hydrogenation (due for example to a lower density) on the grains would lead to higher abundances of CH3OH and (CH2OH)2. A determination of (CH2OH)2/CH2OHCHO ratios in larger samples of star-forming regions could help understand how the initial conditions (density, molecular cloud, etc.) affect their relative abundances.
Online material
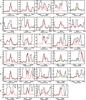 |
Fig. 3 Observed lines of aGg′-(CH2OH)2 toward the protostar NGC 1333 IRAS2A (in black). The best-fit model for aGg′-(CH2OH)2 (see Table 2) is shown as red solid lines. The contributions of the CH3OCHO and CH2OHCHO lines are indicated with green and blue lines. The model including aGg′-(CH2OH)2, CH2OHCHO, and CH3OCHO can be seen as red dotted lines. |
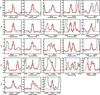 |
Fig. 4 Observed lines of CH3OCHO toward the protostar NGC 1333 IRAS2A (in black). The best-fit model for CH3OCHO (see Table 2) is shown as red lines. |
CH2OHCHO, aGg′-(CH2OH)2 and CH3OCHO transitions observed toward NGC 1333 IRAS2A.
Acknowledgments
The authors are grateful to the IRAM staff, especially Tessel van der Laan, Arancha Castro-Carrizo, Chin-Shin Chang, and Sabine König, for their help with the calibration of the data. This research was supported by a Junior Group Leader Fellowship from the Lundbeck Foundation (to J.K.J.). Centre for Star and Planet Formation is funded by the Danish National Research Foundation. M.V.P. acknowledges EU FP7 grant 291141 CHEMPLAN. The research leading to these results has received funding from the European Commission Seventh Framework Programme (FP/2007-2013) under grant agreement No. 283393 (RadioNet3).
References
- Belloche, A., Müller, H. S. P., Menten, K. M., Schilke, P., & Comito, C. 2013, A&A, 559, A47 [NASA ADS] [CrossRef] [EDP Sciences] [Google Scholar]
- Beltrán, M. T., Codella, C., Viti, S., Neri, R., & Cesaroni, R. 2009, ApJ, 690, L93 [NASA ADS] [CrossRef] [Google Scholar]
- Bisschop, S. E., Jørgensen, J. K., Bourke, T. L., Bottinelli, S., & van Dishoeck, E. F. 2008, A&A, 488, 959 [NASA ADS] [CrossRef] [EDP Sciences] [Google Scholar]
- Biver, N., Bockelée-Morvan, D., Debout, V., et al. 2014, A&A, 566, L5 [Google Scholar]
- Bottinelli, S., Ceccarelli, C., Neri, R., et al. 2004a, ApJ, 617, L69 [NASA ADS] [CrossRef] [Google Scholar]
- Bottinelli, S., Ceccarelli, C., Lefloch, B., et al. 2004b, ApJ, 615, 354 [NASA ADS] [CrossRef] [Google Scholar]
- Bottinelli, S., Ceccarelli, C., Williams, J. P., & Lefloch, B. 2007, A&A, 463, 601 [NASA ADS] [CrossRef] [EDP Sciences] [Google Scholar]
- Butler, R. A. H., De Lucia, F. C., Petkie, D. T., et al. 2001, ApJS, 134, 319 [NASA ADS] [CrossRef] [Google Scholar]
- Carroll, P. B., Drouin, B. J., & Widicus Weaver, S. L. 2010, ApJ, 723, 845 [NASA ADS] [CrossRef] [Google Scholar]
- Cazaux, S., Tielens, A. G. G. M., Ceccarelli, C., et al. 2003, ApJ, 593, L51 [NASA ADS] [CrossRef] [Google Scholar]
- Ceccarelli, C. 2004, in Star Formation in the Interstellar Medium, in Honor of David Hollenbach, ASP Conf. Proc., 323, 195 [NASA ADS] [Google Scholar]
- Christen, D., & Müller, H. S. P. 2003, Phys. Chem. Chem. Phys. (Incorporating Faraday Transactions), 5, 3600 [Google Scholar]
- Christen, D., Coudert, L. H., Suenram, R. D., & Lovas, F. J. 1995, J. Mol. Spectr., 172, 57 [NASA ADS] [CrossRef] [Google Scholar]
- Cooper, G., Kimmich, N., Belisle, W., et al. 2001, Nature, 414, 879 [NASA ADS] [CrossRef] [PubMed] [Google Scholar]
- Coutens, A., Jørgensen, J. K., Persson, M. V., et al. 2014, ApJ, 792, L5 [NASA ADS] [CrossRef] [Google Scholar]
- Crimier, N., Ceccarelli, C., Maret, S., et al. 2010, A&A, 519, A65 [NASA ADS] [CrossRef] [EDP Sciences] [Google Scholar]
- Crovisier, J., Bockelée-Morvan, D., Biver, N., et al. 2004, A&A, 418, L35 [NASA ADS] [CrossRef] [EDP Sciences] [Google Scholar]
- Fedoseev, G., Cupper, H. M., Ioppolo, S., Lamberts, T., & Linnartz, H. 2015, MNRAS, 448, 1288 [NASA ADS] [CrossRef] [Google Scholar]
- Froebrich, D. 2005, ApJS, 156, 169 [NASA ADS] [CrossRef] [Google Scholar]
- Fuchs, G. W., Cuppen, H. M., Ioppolo, S., et al. 2009, A&A, 505, 629 [NASA ADS] [CrossRef] [EDP Sciences] [Google Scholar]
- Fuente, A., Cernicharo, J., Caselli, P., et al. 2014, A&A, 568, A65 [NASA ADS] [CrossRef] [EDP Sciences] [Google Scholar]
- Garrod, R. T. 2013, ApJ, 765, 60 [Google Scholar]
- Garrod, R. T., Weaver, S. L. W., & Herbst, E. 2008, ApJ, 682, 283 [NASA ADS] [CrossRef] [Google Scholar]
- Goldsmith, P. F., & Langer, W. D. 1999, ApJ, 517, 209 [NASA ADS] [CrossRef] [Google Scholar]
- Halfen, D. T., Apponi, A. J., Woolf, N., Polt, R., & Ziurys, L. M. 2006, ApJ, 639, 237 [NASA ADS] [CrossRef] [Google Scholar]
- Herbst, E., & van Dishoeck, E. F. 2009, ARA&A, 47, 427 [NASA ADS] [CrossRef] [Google Scholar]
- Hollis, J. M., Lovas, F. J., & Jewell, P. R. 2000, ApJ, 540, L107 [NASA ADS] [CrossRef] [Google Scholar]
- Hollis, J. M., Vogel, S. N., Snyder, L. E., Jewell, P. R., & Lovas, F. J. 2001, ApJ, 554, L81 [Google Scholar]
- Hollis, J. M., Lovas, F. J., Jewell, P. R., & Coudert, L. H. 2002, ApJ, 571, L59 [NASA ADS] [CrossRef] [Google Scholar]
- Hollis, J. M., Jewell, P. R., Lovas, F. J., & Remijan, A. 2004, ApJ, 613, L45 [NASA ADS] [CrossRef] [Google Scholar]
- Hudson, R. L., & Moore, M. H. 2000, Icarus, 145, 661 [NASA ADS] [CrossRef] [Google Scholar]
- Hudson, R. L., Moore, M. H., & Cook, A. M. 2005, Adv. Space Res., 36, 184 [NASA ADS] [CrossRef] [Google Scholar]
- Ilyushin, V., Kryvda, A., & Alekseev, E. 2009, J. Mol. Spectr., 255, 32 [NASA ADS] [CrossRef] [Google Scholar]
- Jalbout, A. F., Abrell, L., Adamowicz, L., et al. 2007, Astrobiology, 7, 433 [NASA ADS] [CrossRef] [Google Scholar]
- Jørgensen, J. K., Schöier, F. L., & van Dishoeck, E. F. 2002, A&A, 389, 908 [NASA ADS] [CrossRef] [EDP Sciences] [Google Scholar]
- Jørgensen, J. K., Bourke, T. L., Myers, P. C., et al. 2005a, ApJ, 632, 973 [NASA ADS] [CrossRef] [Google Scholar]
- Jørgensen, J. K., Schöier, F. L., & van Dishoeck, E. F. 2005b, A&A, 437, 501 [NASA ADS] [CrossRef] [EDP Sciences] [Google Scholar]
- Jørgensen, J. K., Bourke, T. L., Myers, P. C., et al. 2007, ApJ, 659, 479 [NASA ADS] [CrossRef] [Google Scholar]
- Jørgensen, J. K., Favre, C., Bisschop, S. E., et al. 2012, ApJ, 757, L4 [NASA ADS] [CrossRef] [Google Scholar]
- Karska, A., Herczeg, G. J., van Dishoeck, E. F., et al. 2013, A&A, 552, A141 [NASA ADS] [CrossRef] [EDP Sciences] [Google Scholar]
- Maret, S., Ceccarelli, C., Caux, E., et al. 2004, A&A, 416, 577 [NASA ADS] [CrossRef] [EDP Sciences] [Google Scholar]
- Maury, A. J., Belloche, A., André, P., et al. 2014, A&A, 563, L2 [NASA ADS] [CrossRef] [EDP Sciences] [Google Scholar]
- McCaffrey, V. P., Zellner, N. E. B., Waun, C. M., Bennett, E. R., & Earl, E. K. 2014, Origins of Life and Evolution of the Biosphere, 44, 29 [NASA ADS] [CrossRef] [Google Scholar]
- Müller, H. S. P., & Christen, D. 2004, J. Mol. Spectr., 228, 298 [NASA ADS] [CrossRef] [Google Scholar]
- Müller, H. S. P., Thorwirth, S., Roth, D. A., & Winnewisser, G. 2001, A&A, 370, L49 [NASA ADS] [CrossRef] [EDP Sciences] [Google Scholar]
- Müller, H. S. P., Schlöder, F., Stutzki, J., & Winnewisser, G. 2005, J. Mol. Struct., 742, 215 [NASA ADS] [CrossRef] [Google Scholar]
- Öberg, K. I., Garrod, R. T., van Dishoeck, E. F., & Linnartz, H. 2009, A&A, 504, 891 [NASA ADS] [CrossRef] [EDP Sciences] [Google Scholar]
- Persson, M. V., Jørgensen, J. K., & van Dishoeck, E. F. 2012, A&A, 541, A39 [NASA ADS] [CrossRef] [EDP Sciences] [Google Scholar]
- Persson, M. V., Jørgensen, J. K., van Dishoeck, E. F., & Harsono, D. 2014, A&A, 563, A74 [NASA ADS] [CrossRef] [EDP Sciences] [Google Scholar]
- Pickett, H. M., Poynter, R. L., Cohen, E. A., et al. 1998, J. Quant. Spectr. Rad. Transf., 60, 883 [NASA ADS] [CrossRef] [Google Scholar]
- Requena-Torres, M. A., Martín-Pintado, J., Martín, S., & Morris, M. R. 2008, ApJ, 672, 352 [NASA ADS] [CrossRef] [Google Scholar]
- Schöier, F. L., Jørgensen, J. K., van Dishoeck, E. F., & Blake, G. A. 2002, A&A, 390, 1001 [NASA ADS] [CrossRef] [EDP Sciences] [Google Scholar]
- Watanabe, N., Nagaoka, A., Shiraki, T., & Kouchi, A. 2004, ApJ, 616, 638 [NASA ADS] [CrossRef] [Google Scholar]
- Widicus Weaver, S. L., Butler, R. A. H., Drouin, B. J., et al. 2005, ApJS, 158, 188 [NASA ADS] [CrossRef] [Google Scholar]
- Woods, P. M., Kelly, G., Viti, S., et al. 2012, ApJ, 750, 19 [NASA ADS] [CrossRef] [Google Scholar]
- Woods, P. M., Slater, B., Raza, Z., et al. 2013, ApJ, 777, 90 [NASA ADS] [CrossRef] [Google Scholar]
- Zubay, G., & Mui, T. 2001, Origins of Life and Evolution of the Biosphere, 31, 87 [NASA ADS] [CrossRef] [Google Scholar]
All Tables
Parameters used to compute the synthetic spectra of glycolaldehyde, ethylene glycol, and methyl formate.
(CH2OH)2/CH2OHCHO, CH3OCHO/CH2OHCHO, and CH3OCHO/(CH2OH)2 column density ratios determined in different objects.
All Figures
|
Fig. 1 Rotational diagrams for glycolaldehyde, ethylene glycol, and methyl formate. |
| In the text | |
|
Fig. 2 Observed lines of CH2OHCHO toward the protostar NGC 1333 IRAS2A (in black). The best-fit model for CH2OHCHO (see Table 2) is shown as red solid lines. The line in the third upper panel is blended with an unidentified species. The contribution of the CH3OCHO lines is indicated with green lines, and the model including both CH2OHCHO and CH3OCHO can be seen as red dotted lines. |
| In the text | |
|
Fig. 5 Black: H2 density (solid line) and temperature (dotted line) profiles of the protostar IRAS2A from Jørgensen et al. (2002). Red: H2 density (solid line: power-law model, dashed line: Shu-like model) and temperature (dotted line) profiles of the protostar IRAS 16293 from Crimier et al. (2010). |
| In the text | |
|
Fig. 3 Observed lines of aGg′-(CH2OH)2 toward the protostar NGC 1333 IRAS2A (in black). The best-fit model for aGg′-(CH2OH)2 (see Table 2) is shown as red solid lines. The contributions of the CH3OCHO and CH2OHCHO lines are indicated with green and blue lines. The model including aGg′-(CH2OH)2, CH2OHCHO, and CH3OCHO can be seen as red dotted lines. |
| In the text | |
|
Fig. 4 Observed lines of CH3OCHO toward the protostar NGC 1333 IRAS2A (in black). The best-fit model for CH3OCHO (see Table 2) is shown as red lines. |
| In the text | |
Current usage metrics show cumulative count of Article Views (full-text article views including HTML views, PDF and ePub downloads, according to the available data) and Abstracts Views on Vision4Press platform.
Data correspond to usage on the plateform after 2015. The current usage metrics is available 48-96 hours after online publication and is updated daily on week days.
Initial download of the metrics may take a while.