Fig. 6
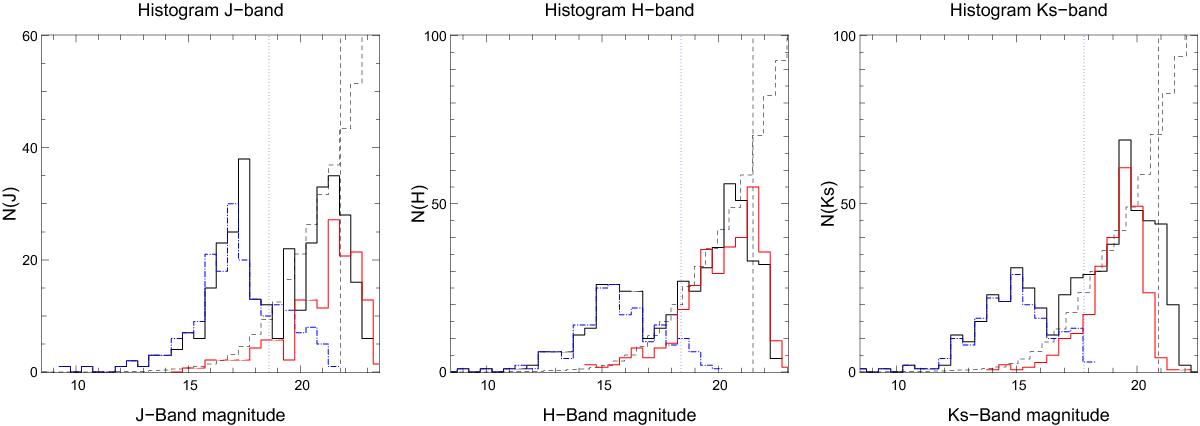
Histogram of the stars for the three filters. GeMS/GSAOI data are the black histograms. Blue histograms are taken from the Santos et al. (2012) catalog, only for number of stars per magnitude bin for the same region as the one covered by GSAOI. For each data set, the completion limit has been added. Dashed histogram show star counts from the Besancon model. Red histogram are the star counts from the control field.
Current usage metrics show cumulative count of Article Views (full-text article views including HTML views, PDF and ePub downloads, according to the available data) and Abstracts Views on Vision4Press platform.
Data correspond to usage on the plateform after 2015. The current usage metrics is available 48-96 hours after online publication and is updated daily on week days.
Initial download of the metrics may take a while.