Fig. 14
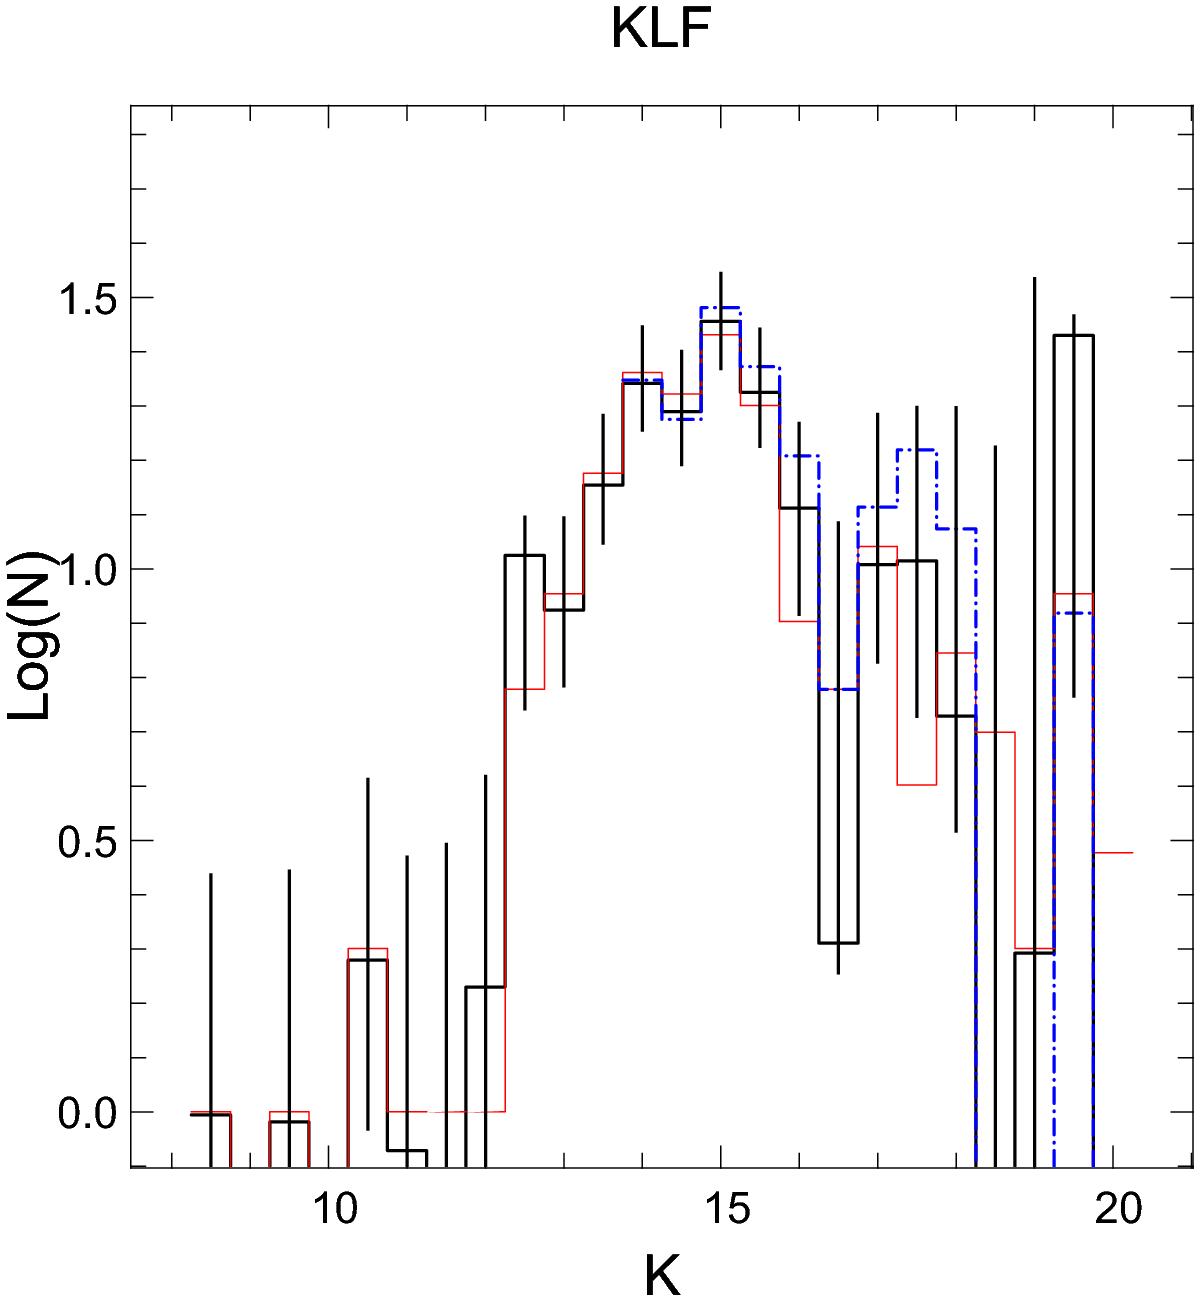
K luminosity function built with different contamination-correction methods. The black histogram shows the KLF when star counts from the galaxy model is used, the blue dash-dot histogram shows the KLF when star count from the control field is used, the red histogram shows the KLF when the color-cut method is used to compensate for contamination (see Sect. 4.3). Vertical error bars are counting statistics uncertainties computed as ![]() for the black histogram.
for the black histogram.
Current usage metrics show cumulative count of Article Views (full-text article views including HTML views, PDF and ePub downloads, according to the available data) and Abstracts Views on Vision4Press platform.
Data correspond to usage on the plateform after 2015. The current usage metrics is available 48-96 hours after online publication and is updated daily on week days.
Initial download of the metrics may take a while.