Fig. 9
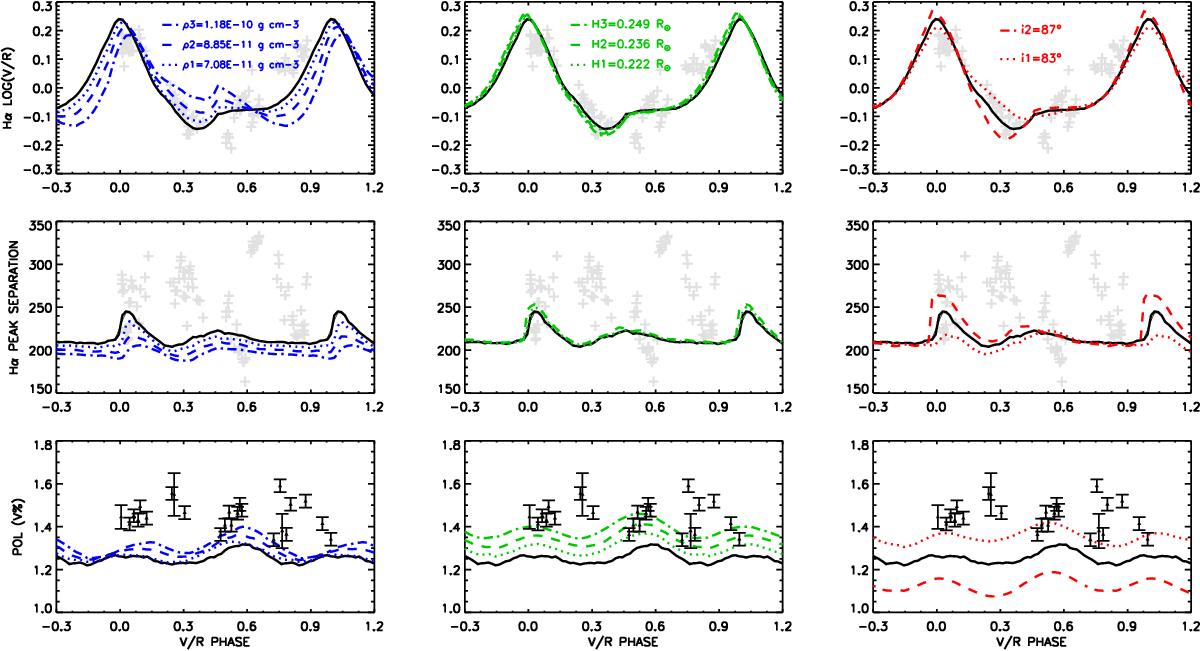
Testing the effect of the disk base density (left column, blue), vertical scale height (middle column, green), and inclination angle (right column, red) on the V/R variations (top and center row) and V band polarization (bottom row) predicted by HDUST models. The black solid line represents Model 3, taken here as a reference for our tests. The model parameters are summarized in Table 2. For clarity, we limited the V/R observational sample at Cycle I only and plotted it in light gray.
Current usage metrics show cumulative count of Article Views (full-text article views including HTML views, PDF and ePub downloads, according to the available data) and Abstracts Views on Vision4Press platform.
Data correspond to usage on the plateform after 2015. The current usage metrics is available 48-96 hours after online publication and is updated daily on week days.
Initial download of the metrics may take a while.