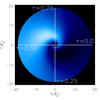
Fig. 8
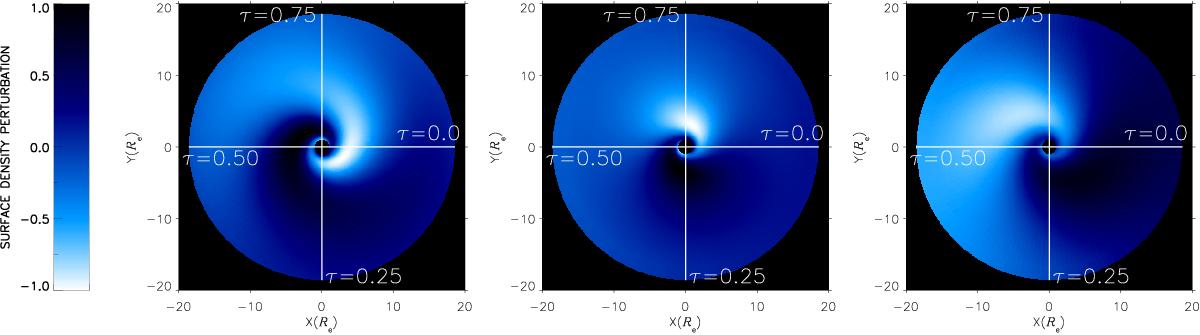
Density perturbation pattern as predicted by three different disk oscillation models. From left to right are presented a 2D model with α = 0.4 (Model 1), a 2.5D model with α = 0.4 (Model 2), and a 2.5D model with α = 0.8 (Model 3). In these representations, the disk is seen from above and the x- and y-axes express the distance from the center of the star in stellar radii. The color scheme indicates the amplitude of the surface density perturbation (Σ′), normalized by the unperturbed value (Σ). Darker colors indicate over-densities and lighter color sub-densities. The line of sight toward the observer is marked in four directions, sampling the V/R cycle in phase from τ = 0. (i.e., maximum V/R) to τ = 0.75.
Current usage metrics show cumulative count of Article Views (full-text article views including HTML views, PDF and ePub downloads, according to the available data) and Abstracts Views on Vision4Press platform.
Data correspond to usage on the plateform after 2015. The current usage metrics is available 48-96 hours after online publication and is updated daily on week days.
Initial download of the metrics may take a while.