Free Access
Fig. 5
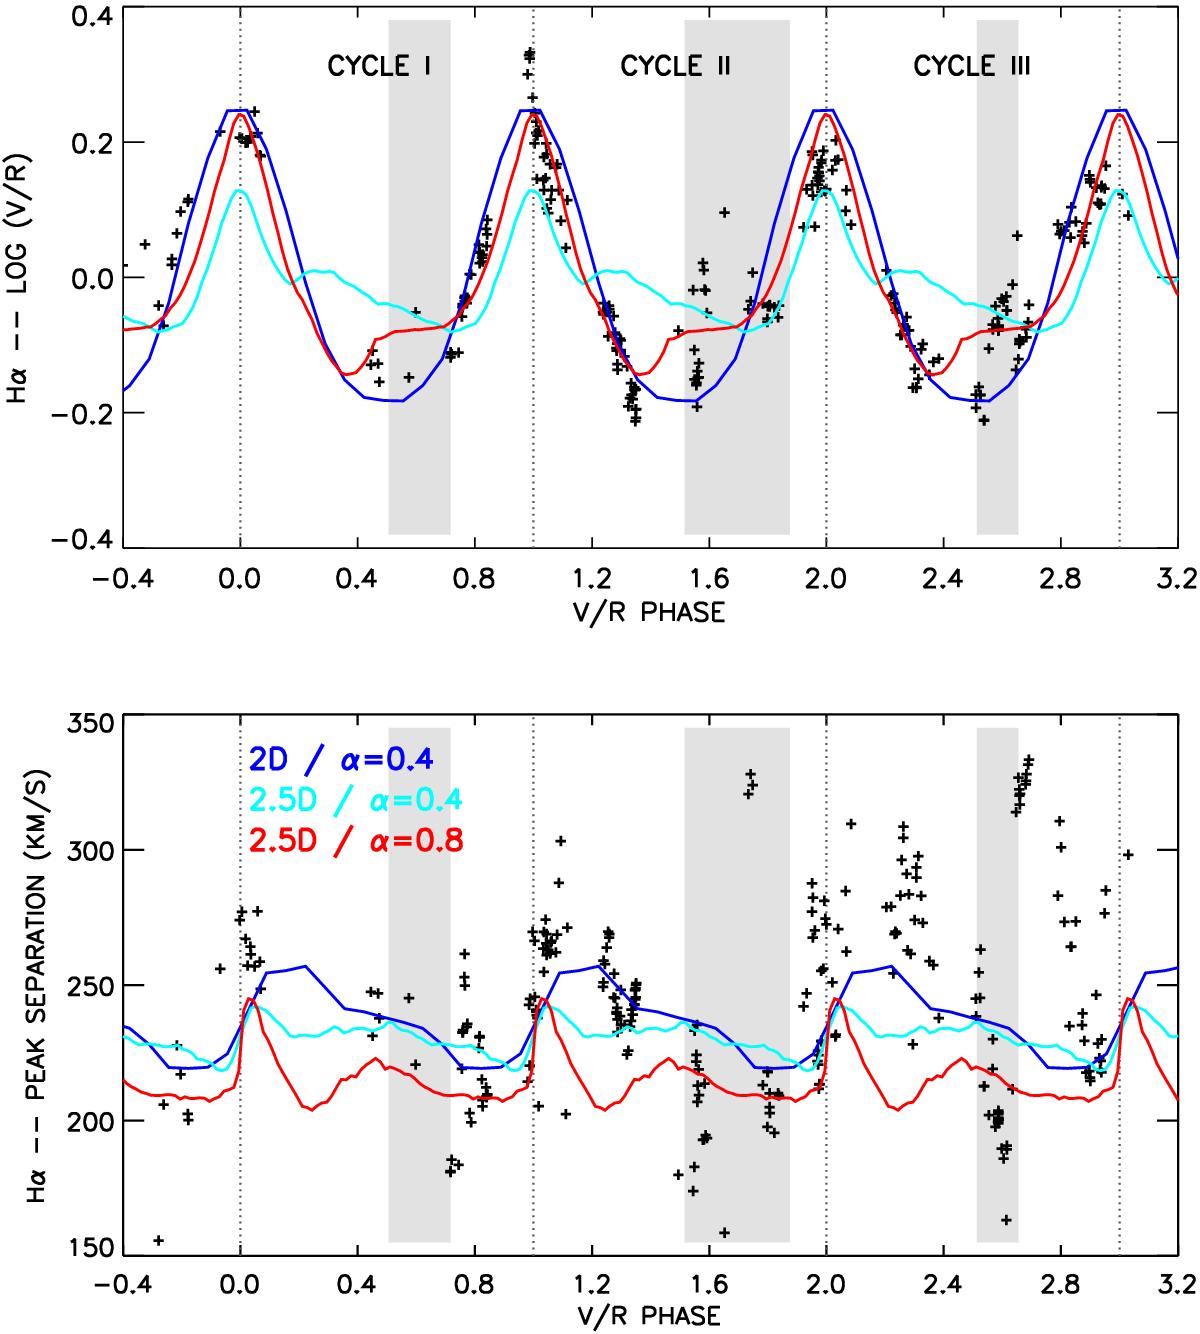
V/R variations (upper panel) and peak separation (lower panel) of Hα. The observed points are the same as in Figs. 1 and 3, but converted in phase to facilitate the comparison with our models. The solid blue line corresponds to Model 1, cyan to Model 2, and red to Model 3. The regions in gray mark the triple-peak phases.
This figure is made of several images, please see below:
Current usage metrics show cumulative count of Article Views (full-text article views including HTML views, PDF and ePub downloads, according to the available data) and Abstracts Views on Vision4Press platform.
Data correspond to usage on the plateform after 2015. The current usage metrics is available 48-96 hours after online publication and is updated daily on week days.
Initial download of the metrics may take a while.