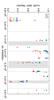
Fig. 3
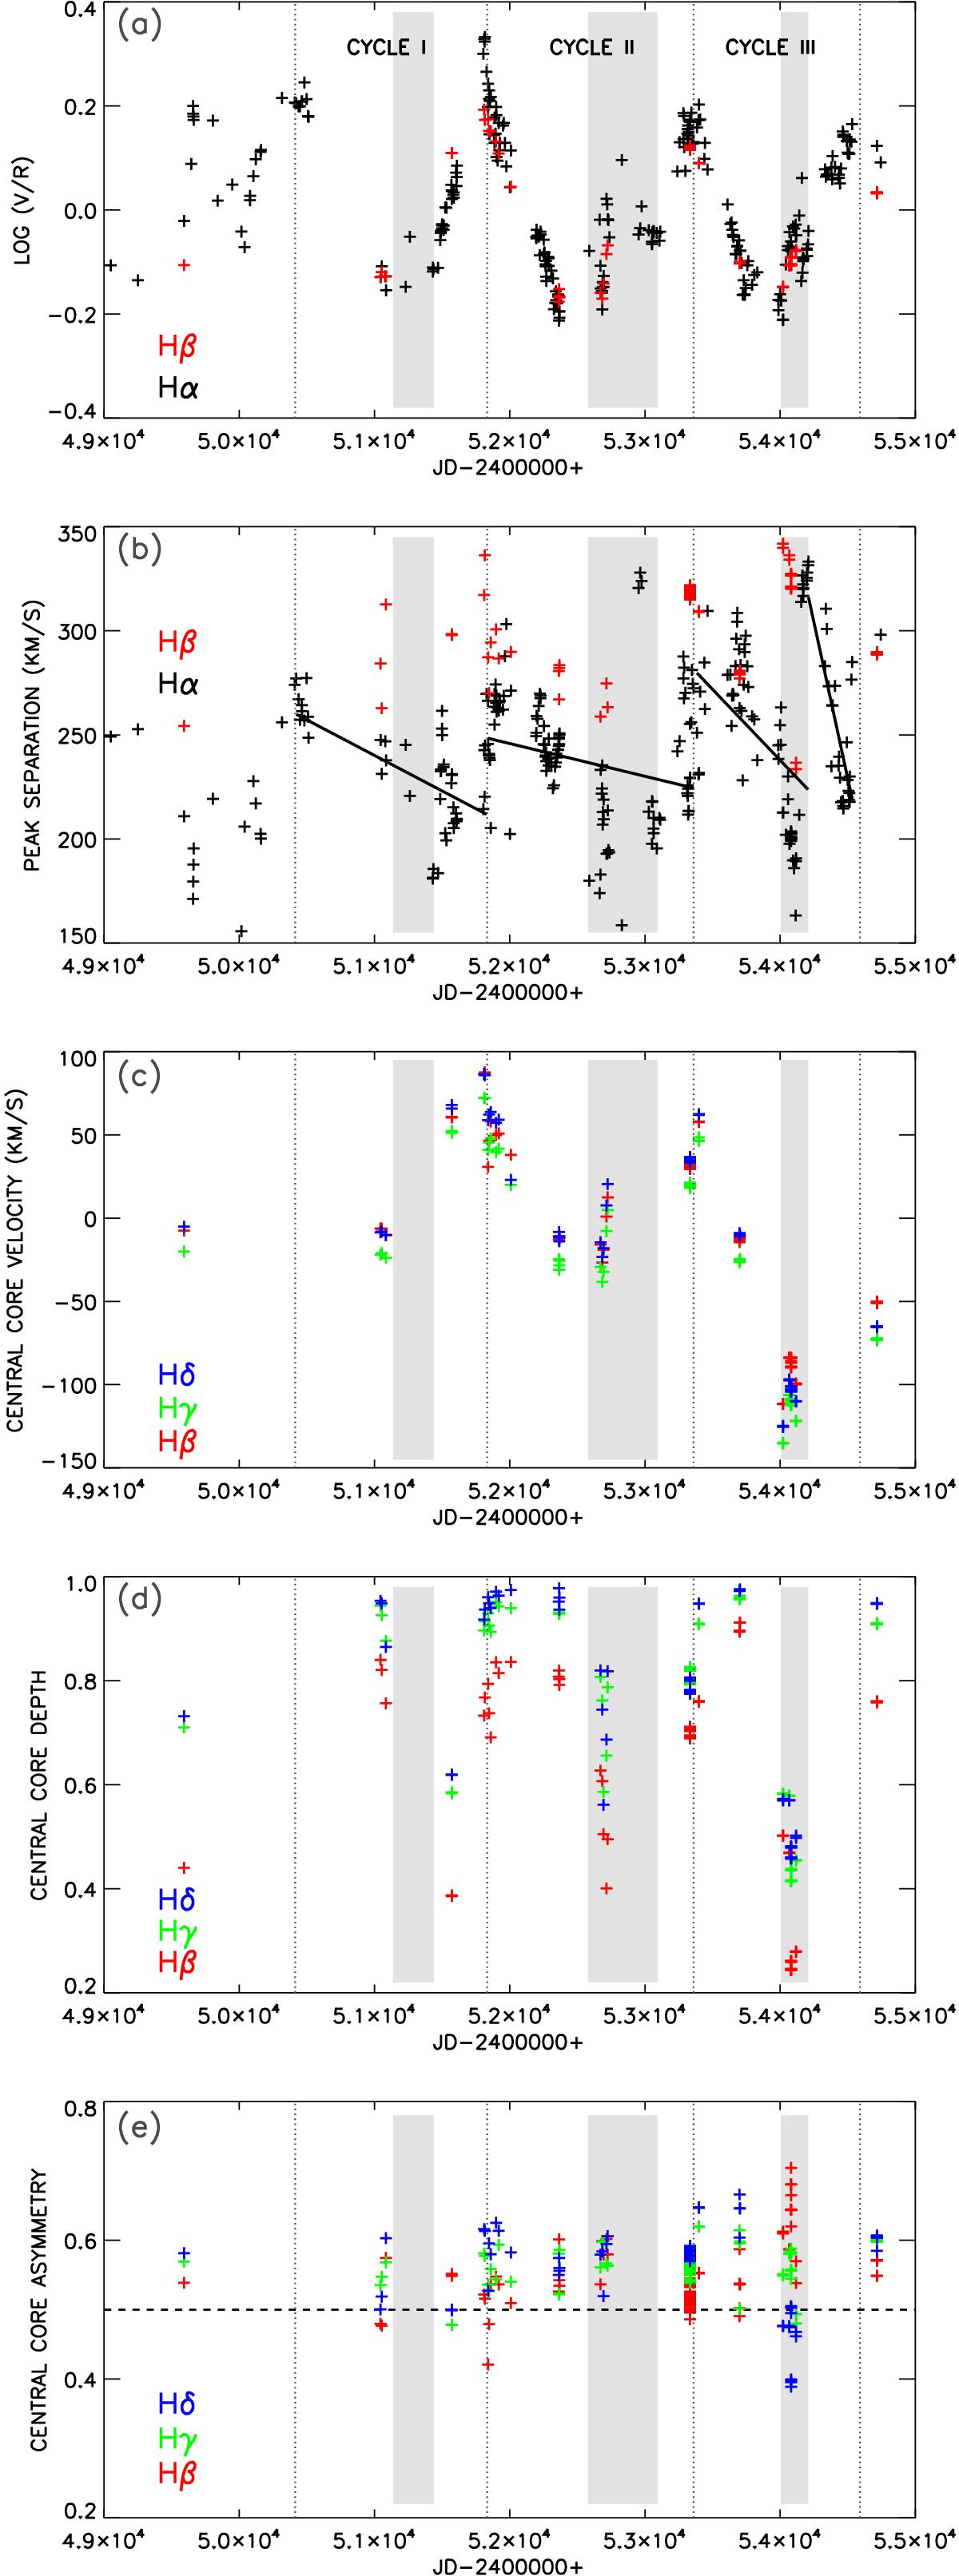
From top to bottom: V/R variations and peak separation (Hα, Hβ), position, depth, and asymmetry of the central absorption (Hβ, Hγ, Hδ) as a function of time, expressed in Julian Days. The V/R maxima are indicated by vertical dotted lines. The regions in gray mark the triple-peak phases. Black, red, blue, and green symbols correspond respectively to Hα, Hβ, Hγ, and Hδ measurements. The black solid lines in panel b) are linear regressions applied to Hα peak separation.
Current usage metrics show cumulative count of Article Views (full-text article views including HTML views, PDF and ePub downloads, according to the available data) and Abstracts Views on Vision4Press platform.
Data correspond to usage on the plateform after 2015. The current usage metrics is available 48-96 hours after online publication and is updated daily on week days.
Initial download of the metrics may take a while.