Free Access
Fig. 2
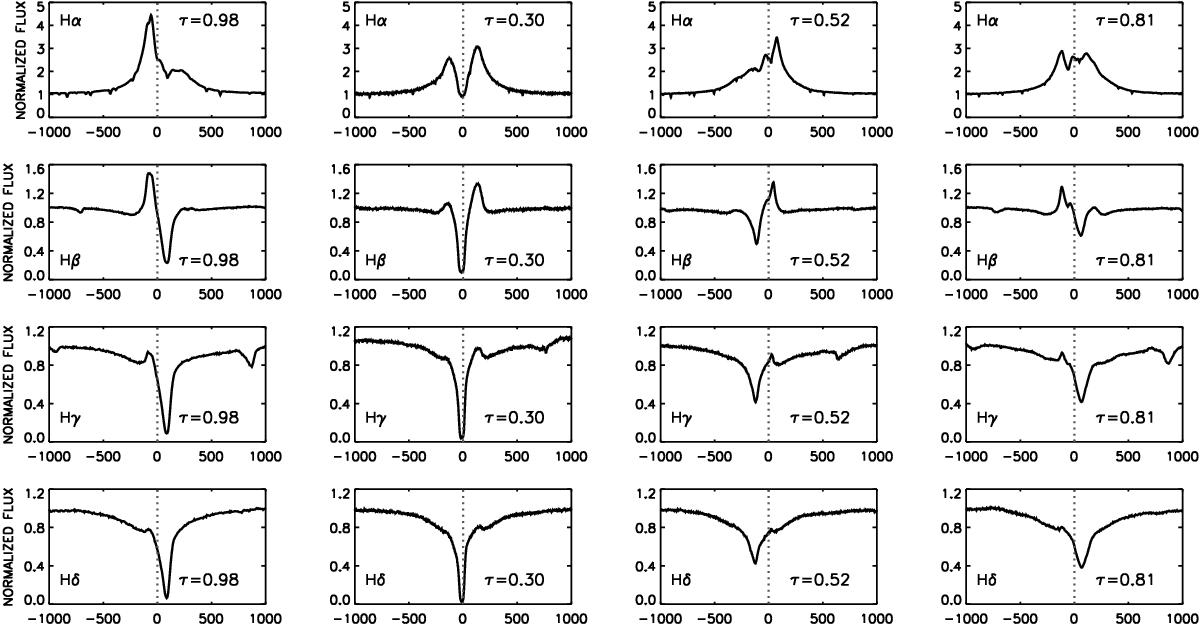
Optical spectrum of ζ Tauri observed at different phases of the V/R cycle. From left to right: V/R phases τ = 0.98, 0.30, 0.52, and 0.81; from top to bottom: successive Balmer lines from Hα to Hδ. The vertical dotted line marks the rest velocity (vrad = 0 km s-1).
Current usage metrics show cumulative count of Article Views (full-text article views including HTML views, PDF and ePub downloads, according to the available data) and Abstracts Views on Vision4Press platform.
Data correspond to usage on the plateform after 2015. The current usage metrics is available 48-96 hours after online publication and is updated daily on week days.
Initial download of the metrics may take a while.