Fig. 1
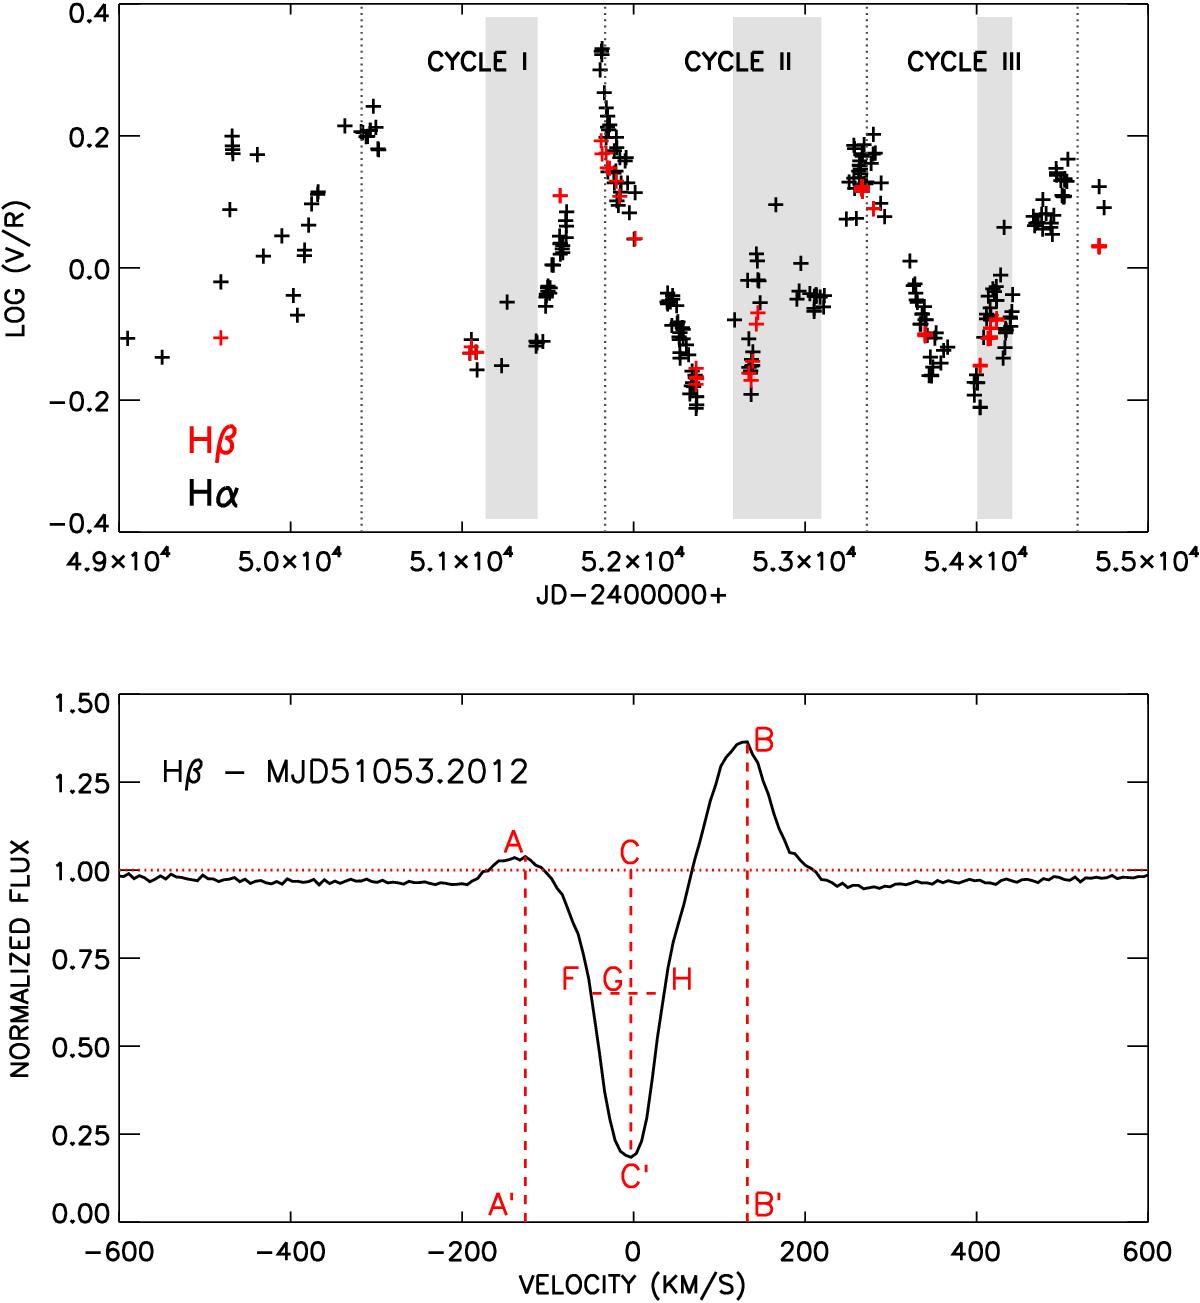
Top: Hα (black) and Hβ (red) V/R curves. Three complete V/R cycles were covered between 1997 and 2010. The gray regions indicate the triple-peak phase for each cycle. Bottom: measured quantities illustrated on a Hβ line profile: violet (AA′) and red (BB′) emission peaks, depth of the central absorption (CC′) and asymmetry (FG/FH ratio). The respective radial velocities of the three components (emission peaks and central absorption) were measured whenever possible. The horizontal line marks the normalized continuum.
Current usage metrics show cumulative count of Article Views (full-text article views including HTML views, PDF and ePub downloads, according to the available data) and Abstracts Views on Vision4Press platform.
Data correspond to usage on the plateform after 2015. The current usage metrics is available 48-96 hours after online publication and is updated daily on week days.
Initial download of the metrics may take a while.