Fig. 6
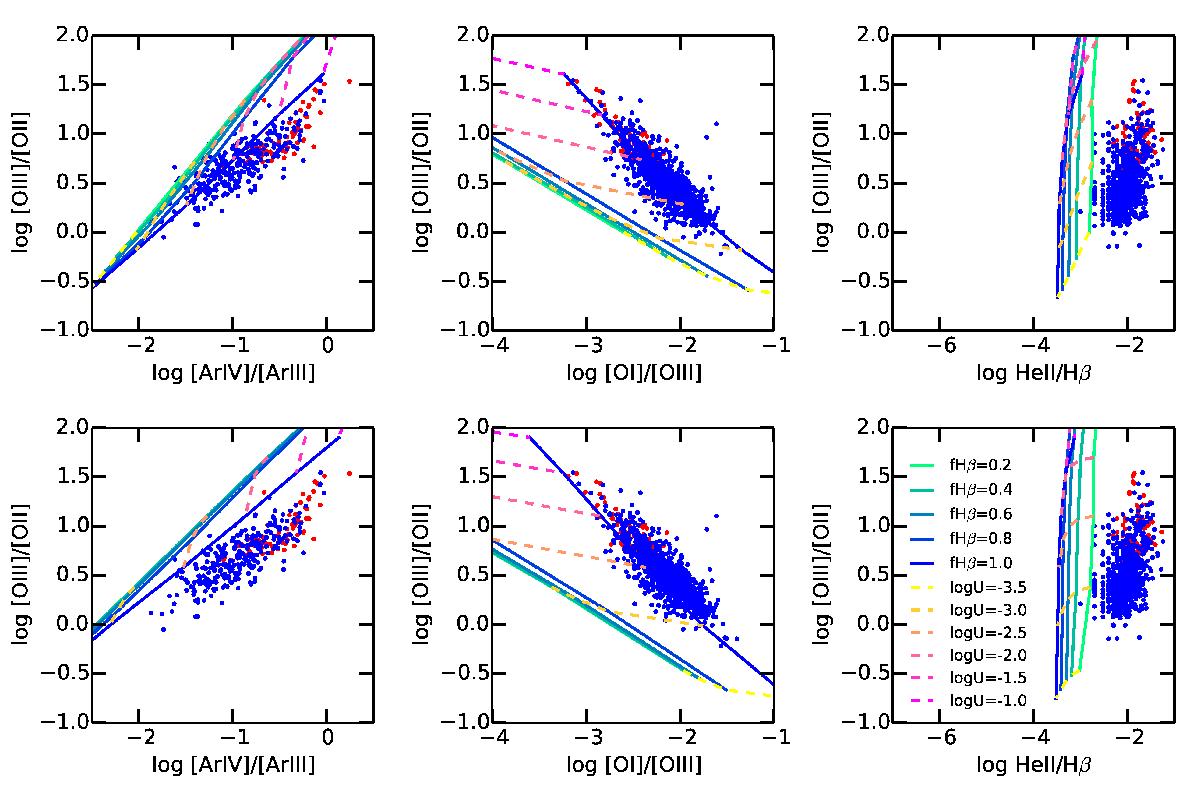
[O iii]/[O ii] versus [Ar iv]/[Ar iii] (left), [O iii]/[O ii] versus [O i]/[O iii] (middle) and [O iii]/[O ii] versus He ii/Hβ (right) diagnostic diagrams. The red and blue points represent the DR10 and DR7 objects respectively. The curves represent our grid of models computed with the SED from PopStar models at an age of 1 Myr and with a metallicity 12 + log O/H = 8. The dashed lines link models with the same values of ![]() , the continuous lines link models with the same value of the trimming parameter fHβ, the ionization-bounded models corresponding to fHβ = 1. The key for the colors is given in the bottom right panel. Upper row of panels: our filled sphere models (fS = 0.03), while the lower row corresponds to our bubble models (fS = 3).
, the continuous lines link models with the same value of the trimming parameter fHβ, the ionization-bounded models corresponding to fHβ = 1. The key for the colors is given in the bottom right panel. Upper row of panels: our filled sphere models (fS = 0.03), while the lower row corresponds to our bubble models (fS = 3).
Current usage metrics show cumulative count of Article Views (full-text article views including HTML views, PDF and ePub downloads, according to the available data) and Abstracts Views on Vision4Press platform.
Data correspond to usage on the plateform after 2015. The current usage metrics is available 48-96 hours after online publication and is updated daily on week days.
Initial download of the metrics may take a while.