Free Access
Fig. 2
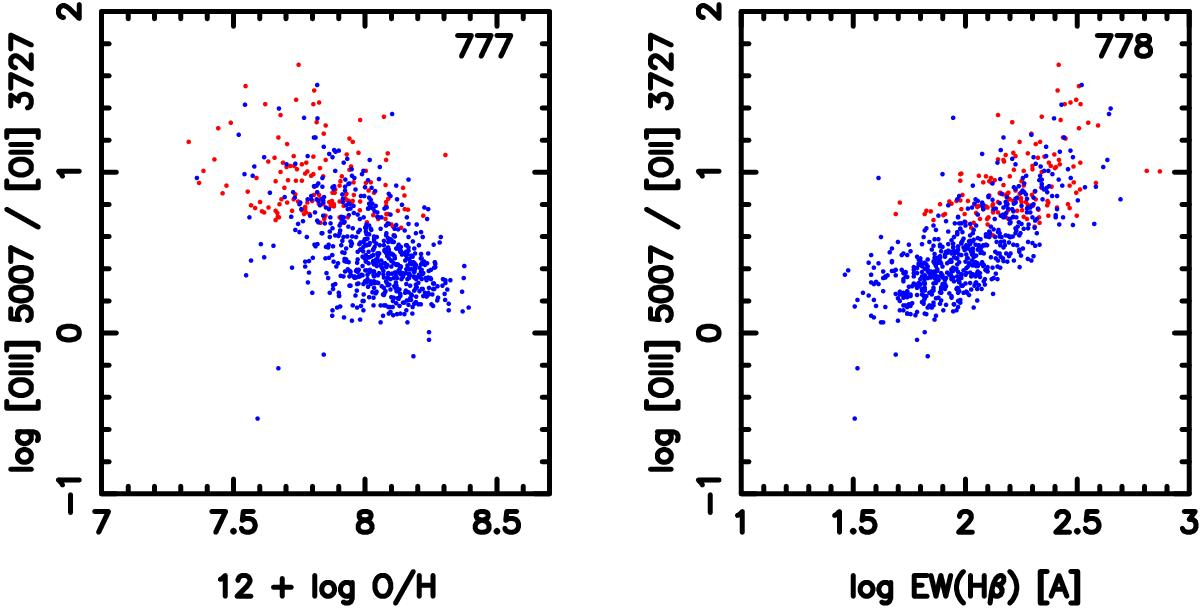
[O iii]/[O ii] ratio as a function of the oxygen abundance 12 + log O/H (left panel) and as a function of the equivalent width of the Hβ line (right panel). DR10 objects are represented in red and those of DR7 in blue. The total number of objects in each panel is indicated in the top right corner.
Current usage metrics show cumulative count of Article Views (full-text article views including HTML views, PDF and ePub downloads, according to the available data) and Abstracts Views on Vision4Press platform.
Data correspond to usage on the plateform after 2015. The current usage metrics is available 48-96 hours after online publication and is updated daily on week days.
Initial download of the metrics may take a while.