Free Access
Fig. 13
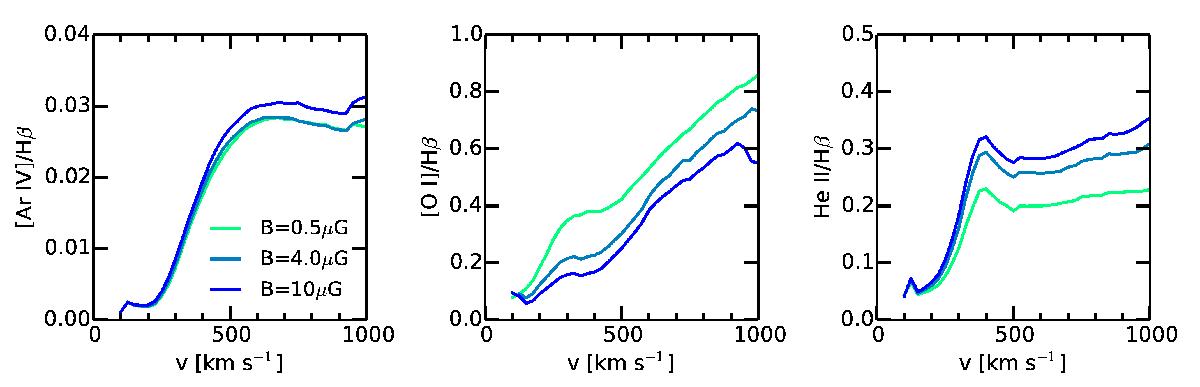
Line ratios He ii/Hβ (left panel), [O i]/Hβ (middle panel), and [Ar iv]/Hβ (right panel) as a function of shock velocity for the shock models from Allen et al. (2008; see text). The different curves correspond to different values of the magnetic field, with the color code indicated in the left panel.
Current usage metrics show cumulative count of Article Views (full-text article views including HTML views, PDF and ePub downloads, according to the available data) and Abstracts Views on Vision4Press platform.
Data correspond to usage on the plateform after 2015. The current usage metrics is available 48-96 hours after online publication and is updated daily on week days.
Initial download of the metrics may take a while.