Fig. 11
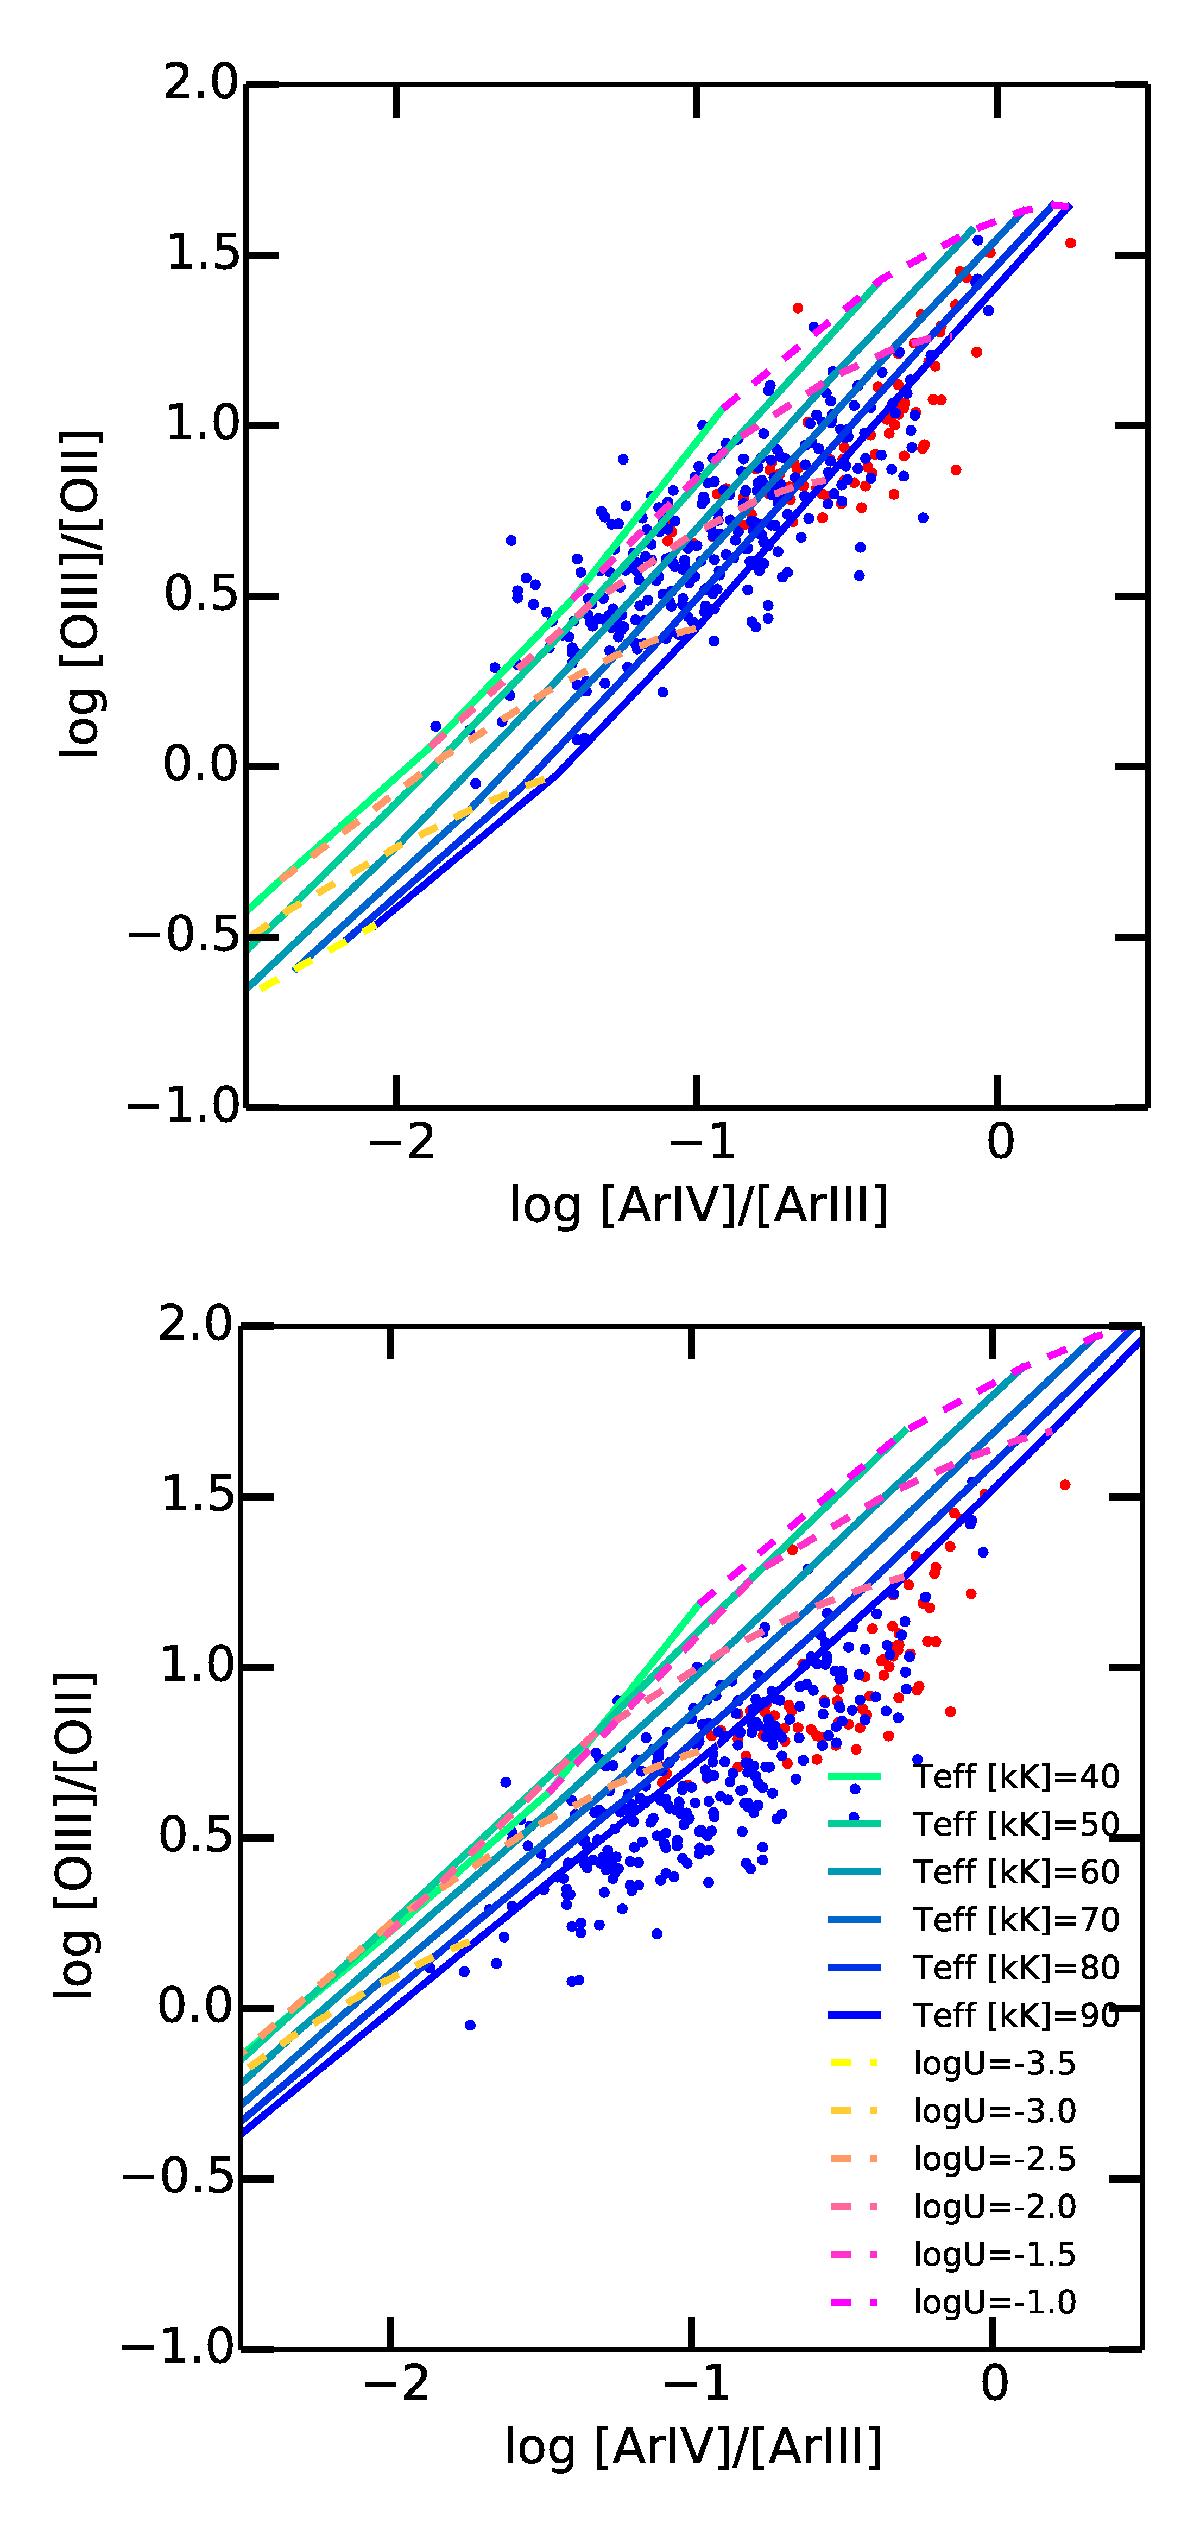
[O iii]/[O ii] vs. [Ar iv]/[Ar iii] diagram for ionization-bounded photoionization models with a blackbody ionization source (12 + log O/H = 8). Top panel: models for filled spheres; bottom panel: models for spherical bubbles. Continuous lines correspond to different values of the effective temperature, while dashed lines correspond to different values of the ionization parameter. The color coding is indicated in the plot. The positions of the observational points for our samples (red for DR10, blue for DR7) are shown for comparison. This diagram shows that for a given value of [O iii]/[O ii] the value of [Ar iv]/[Ar iii] increases with Teff.

Current usage metrics show cumulative count of Article Views (full-text article views including HTML views, PDF and ePub downloads, according to the available data) and Abstracts Views on Vision4Press platform.
Data correspond to usage on the plateform after 2015. The current usage metrics is available 48-96 hours after online publication and is updated daily on week days.
Initial download of the metrics may take a while.