Fig. 1
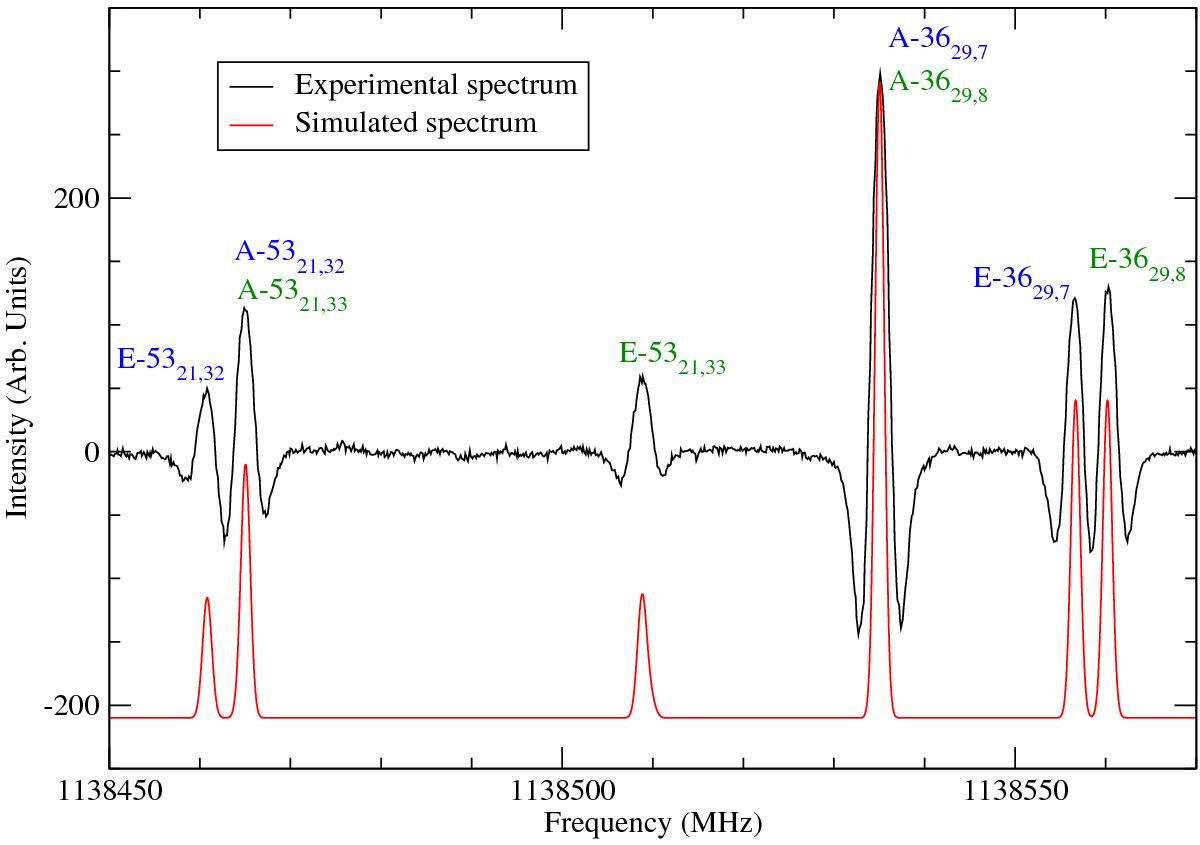
Portion of the experimental spectrum recorded with the JPL experimental setup in
the frequency range 1 138 450−1 138
570 MHz. The simulated spectrum is also provided by using the
Hamiltonian parameter values given in Table 2
and the dipole moment components as explained in the text. The involved features are
assigned as Γ−JKa,Kc
for a transition to a state with J′ = J − 1,
![]() , and
, and
![]() and with symmetry Γ (A or E). Transitions
J =
Ka +
Kc are labeled
in blue and J + 1 =
Ka +
Kc in green.
and with symmetry Γ (A or E). Transitions
J =
Ka +
Kc are labeled
in blue and J + 1 =
Ka +
Kc in green.
Current usage metrics show cumulative count of Article Views (full-text article views including HTML views, PDF and ePub downloads, according to the available data) and Abstracts Views on Vision4Press platform.
Data correspond to usage on the plateform after 2015. The current usage metrics is available 48-96 hours after online publication and is updated daily on week days.
Initial download of the metrics may take a while.