Fig. 3
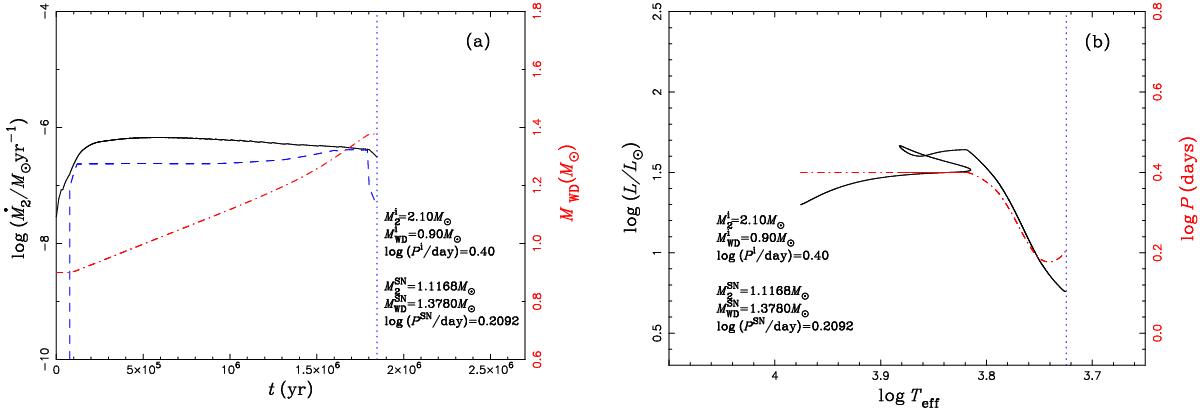
Representative example of binary evolution calculations, where the binary system is in the weak H-shell flash phase at the moment of the SN explosion. In panel a), the solid, dashed, and dashed-dotted curves present Ṁ2, ṀCO, and MWD, varying with time. In panel b), the evolutionary track of the donor in the Hertzsprung-Russell diagram is shown as a solid curve, and the evolution of orbital period is shown as a dashed-dotted curve. Dotted vertical lines in both panels indicate the position where the WD produces an SN Ia.
Current usage metrics show cumulative count of Article Views (full-text article views including HTML views, PDF and ePub downloads, according to the available data) and Abstracts Views on Vision4Press platform.
Data correspond to usage on the plateform after 2015. The current usage metrics is available 48-96 hours after online publication and is updated daily on week days.
Initial download of the metrics may take a while.