Fig. 4
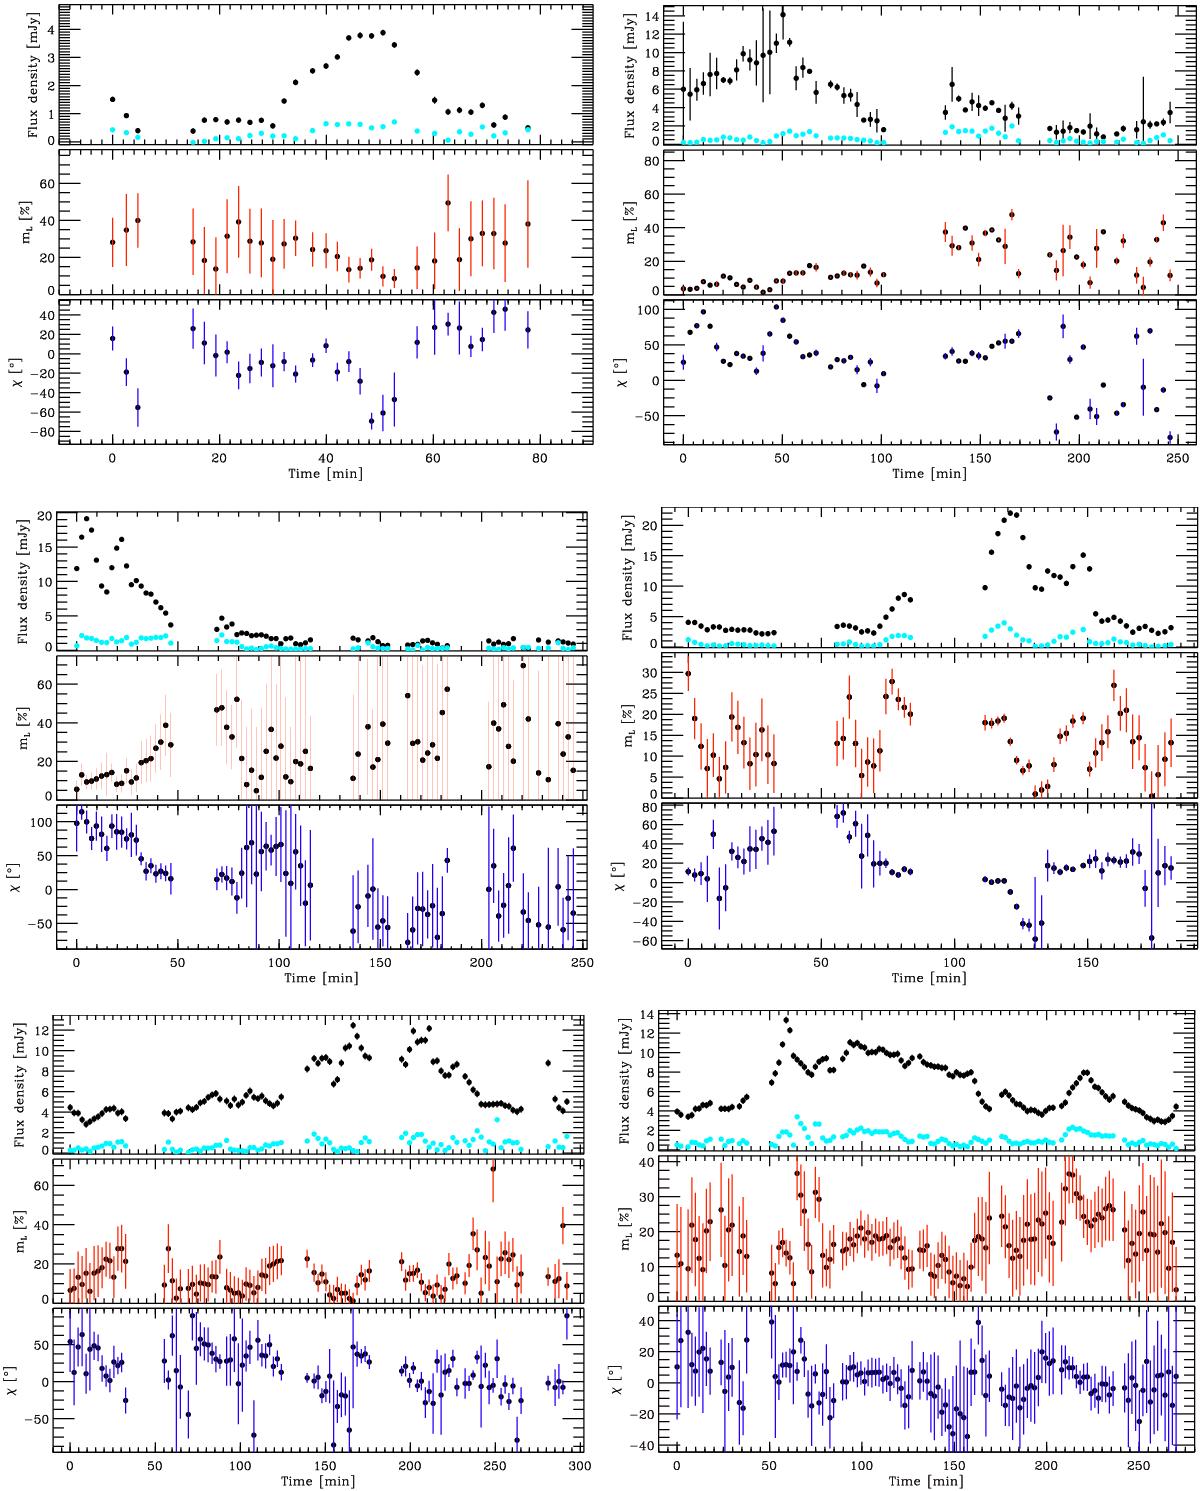
Flux density excesses (flares) observed in NIR Ks-band polarimetry mode of Sgr A*. These events were observed on 2004 June 13, 2005 July 30, 2006 June 1, 2007 May 15, 2007 May 17, 2008 May 25, 2008 May 27, 2008 May 30, 2008 June 1, 2008 June 3, 2009 May 18, 2011 May 27, 2012 May 17 (the order of the images starts from top left to bottom right). In each panel: top: total flux density (black) and polarized flux density (cyan; polarization degree times total flux density) measured in mJy; middle: degree of linear polarization (red); bottom: polarization angle (blue).
Current usage metrics show cumulative count of Article Views (full-text article views including HTML views, PDF and ePub downloads, according to the available data) and Abstracts Views on Vision4Press platform.
Data correspond to usage on the plateform after 2015. The current usage metrics is available 48-96 hours after online publication and is updated daily on week days.
Initial download of the metrics may take a while.