Fig. 3
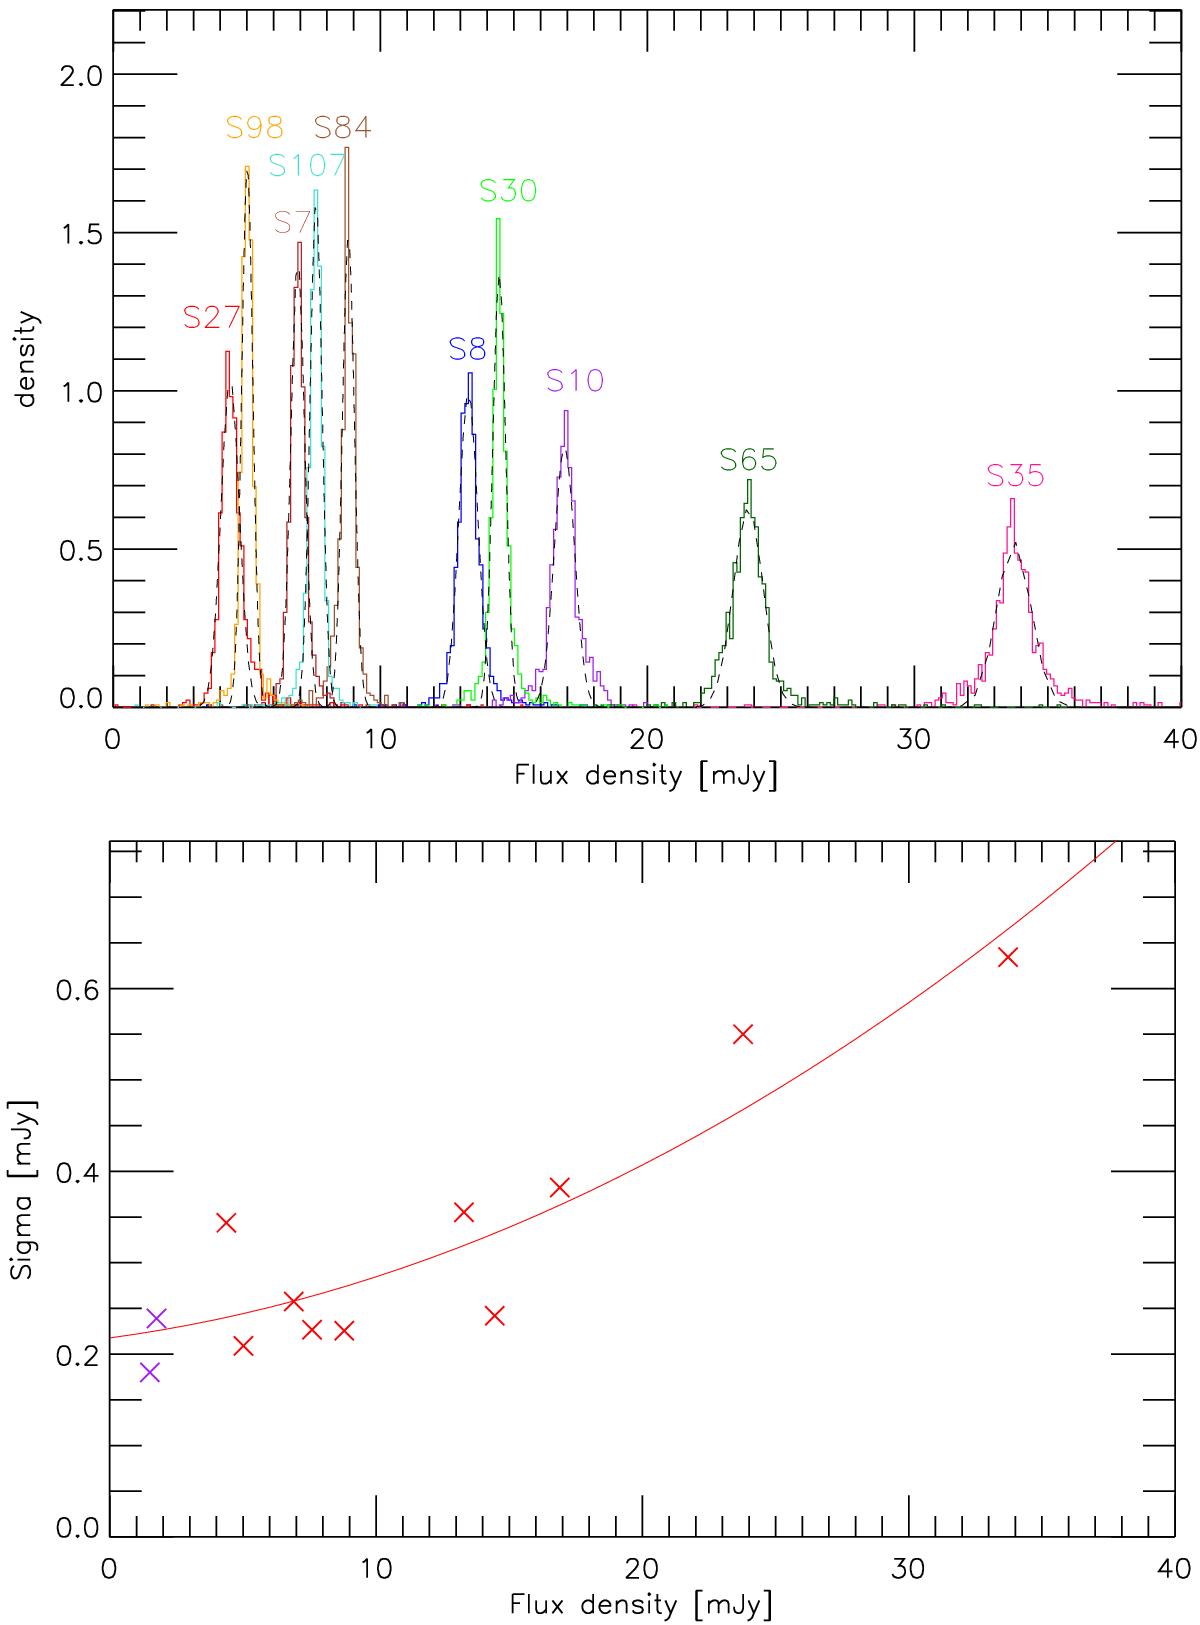
Top: normalized flux density distributions of 10 flux calibrators of Sgr A*. The dashed lines are Gaussian fits to the distributions. Bottom: standard deviation of flux densities of calibration stars versus flux densities of them. The red line is the polynomial fit to the measured σ values of the calibrators shown in the upper panel (red crosses). The two purple x symbols present the measured error values (obtained by Witzel et al. 2012) at the position of the comparison apertures for the background emission close to the position of Sgr A* (see Fig. 2).
Current usage metrics show cumulative count of Article Views (full-text article views including HTML views, PDF and ePub downloads, according to the available data) and Abstracts Views on Vision4Press platform.
Data correspond to usage on the plateform after 2015. The current usage metrics is available 48-96 hours after online publication and is updated daily on week days.
Initial download of the metrics may take a while.