Fig. 1
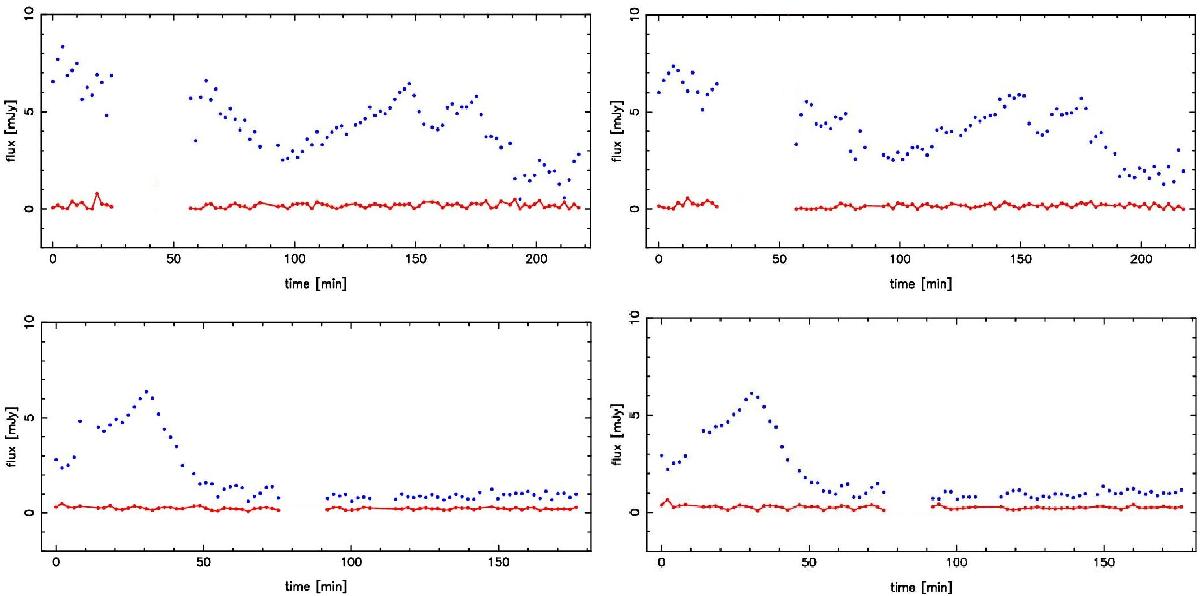
NIR Ks-band (2.2 μm) light curves of Sgr A* observed in polarimetry mode on 27 May 2011 (top) and 17 May 2012 (bottom) produced by combining pairs of orthogonal polarization channels; left: 0°, 90° and right: 45°, 135°. The blue dots show Sgr A* flux density measured in mJy, while the red connected dots show the background flux densities.
Current usage metrics show cumulative count of Article Views (full-text article views including HTML views, PDF and ePub downloads, according to the available data) and Abstracts Views on Vision4Press platform.
Data correspond to usage on the plateform after 2015. The current usage metrics is available 48-96 hours after online publication and is updated daily on week days.
Initial download of the metrics may take a while.