Fig. 7
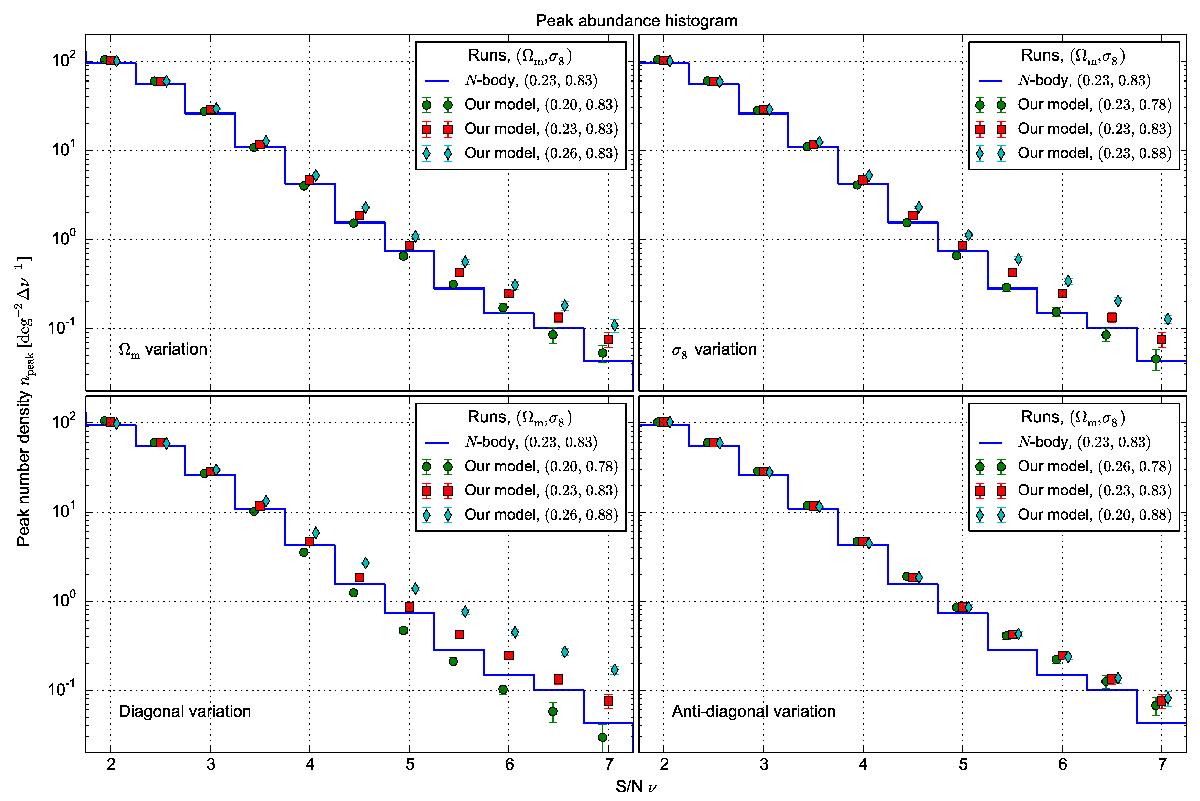
Sensitivity tests on (Ωm,σ8). The four plots indicate different variation directions in the Ωm-σ8 plane. The upper left, upper right, lower left, and lower right panels: variation in Ωm, σ8, diagonal, and anti-diagonal direction, respectively. Blue solid lines represent full N-body runs, while red squares are always our model with N-body input. The field of view is 859 deg2. The N-body data is only indicative.
Current usage metrics show cumulative count of Article Views (full-text article views including HTML views, PDF and ePub downloads, according to the available data) and Abstracts Views on Vision4Press platform.
Data correspond to usage on the plateform after 2015. The current usage metrics is available 48-96 hours after online publication and is updated daily on week days.
Initial download of the metrics may take a while.