Fig. 4
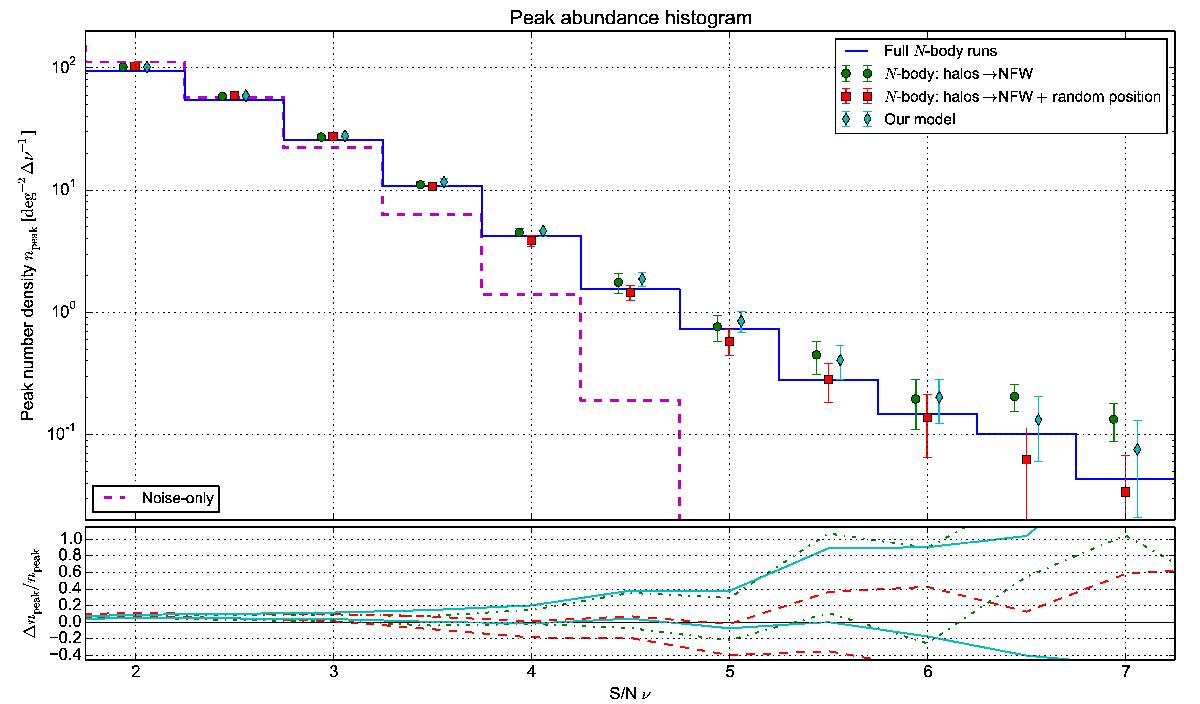
Comparison of the peak abundance from different cases. Upper panel: blue solid line: full N-body runs (Case 1); green circles: replacement of halos by NFW profiles (Case 2); red squares: replacement of halos by NFW profiles and randomization of halo angular positions (Case 3); cyan diamonds: fast simulations, corresponding to our model (Case 4); magenta dashed line: peaks from noise-only maps. Lower panel: we draw the upper and lower limits of error bars shifted with regard to the N-body values. This refers to the standard deviation over 4 maps (green dash-dotted line for Case 2) or 16 maps (red dashed line for Case 3, cyan solid line for Case 4). The field of view is 53.7 deg2.
Current usage metrics show cumulative count of Article Views (full-text article views including HTML views, PDF and ePub downloads, according to the available data) and Abstracts Views on Vision4Press platform.
Data correspond to usage on the plateform after 2015. The current usage metrics is available 48-96 hours after online publication and is updated daily on week days.
Initial download of the metrics may take a while.