Fig. 3
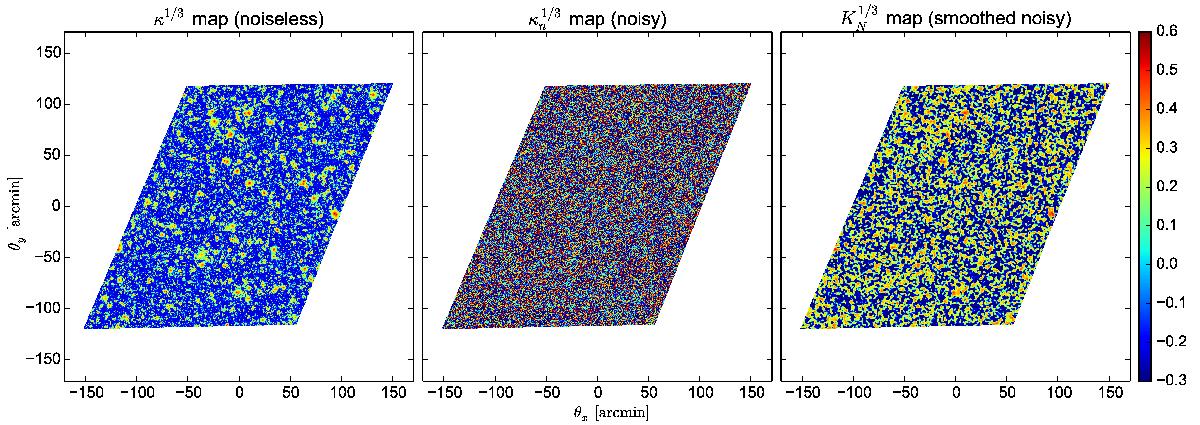
Patch of a map projected with regard to its center, taken from a realization of fast simulations. The left, middle, and right panels give the fields κ1 / 3, ![]() , and
, and ![]() , respectively. We have taken the cubic root to emphasize the contrast. It is clear that the signal is completely dominated by the noise. Even though the smoothed map is quite different from the original one, the structures, high-signal regions are still conserved and traced.
, respectively. We have taken the cubic root to emphasize the contrast. It is clear that the signal is completely dominated by the noise. Even though the smoothed map is quite different from the original one, the structures, high-signal regions are still conserved and traced.
Current usage metrics show cumulative count of Article Views (full-text article views including HTML views, PDF and ePub downloads, according to the available data) and Abstracts Views on Vision4Press platform.
Data correspond to usage on the plateform after 2015. The current usage metrics is available 48-96 hours after online publication and is updated daily on week days.
Initial download of the metrics may take a while.