Free Access
Fig. 2
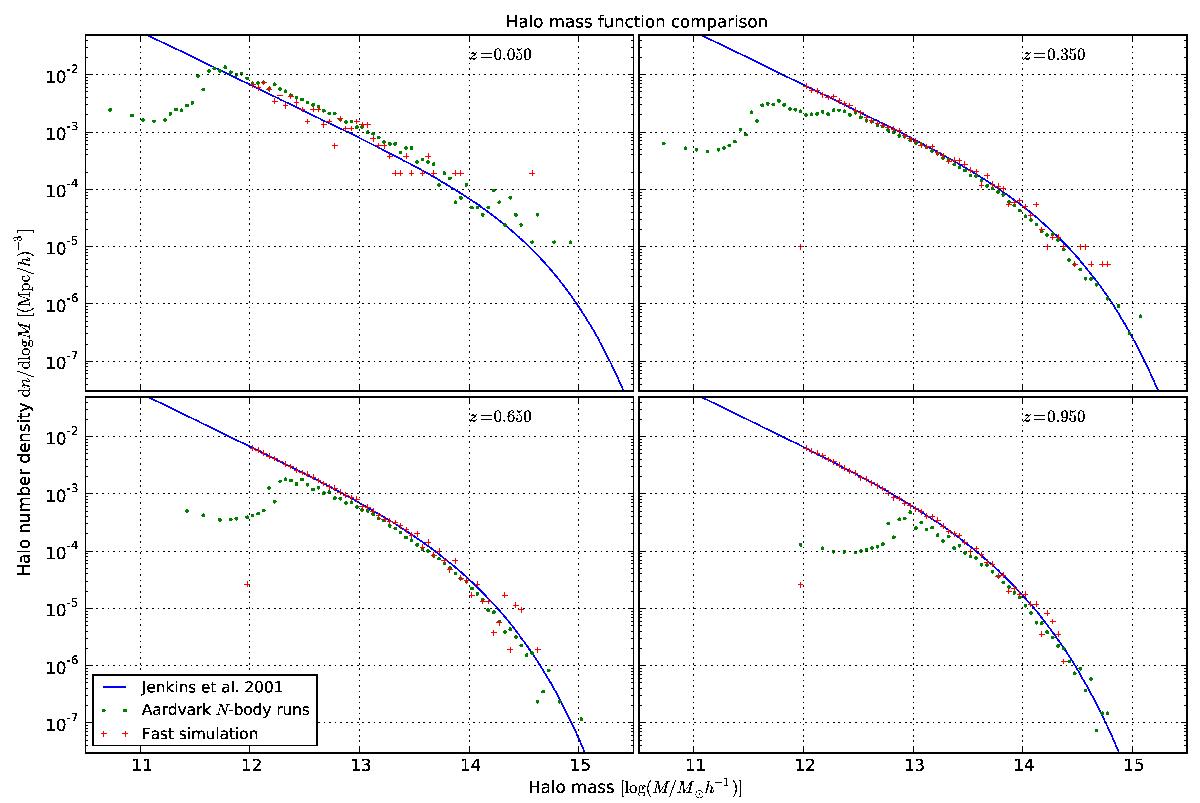
Comparison between an analytical mass function (blue line), halo mass histograms for N-body runs (green points), and sample histograms for realizing of the fast simulation (red crosses). The plots are drawn at 4 different redshift planes, and for each the thickness is dz = 0.1.
Current usage metrics show cumulative count of Article Views (full-text article views including HTML views, PDF and ePub downloads, according to the available data) and Abstracts Views on Vision4Press platform.
Data correspond to usage on the plateform after 2015. The current usage metrics is available 48-96 hours after online publication and is updated daily on week days.
Initial download of the metrics may take a while.