Fig. 1
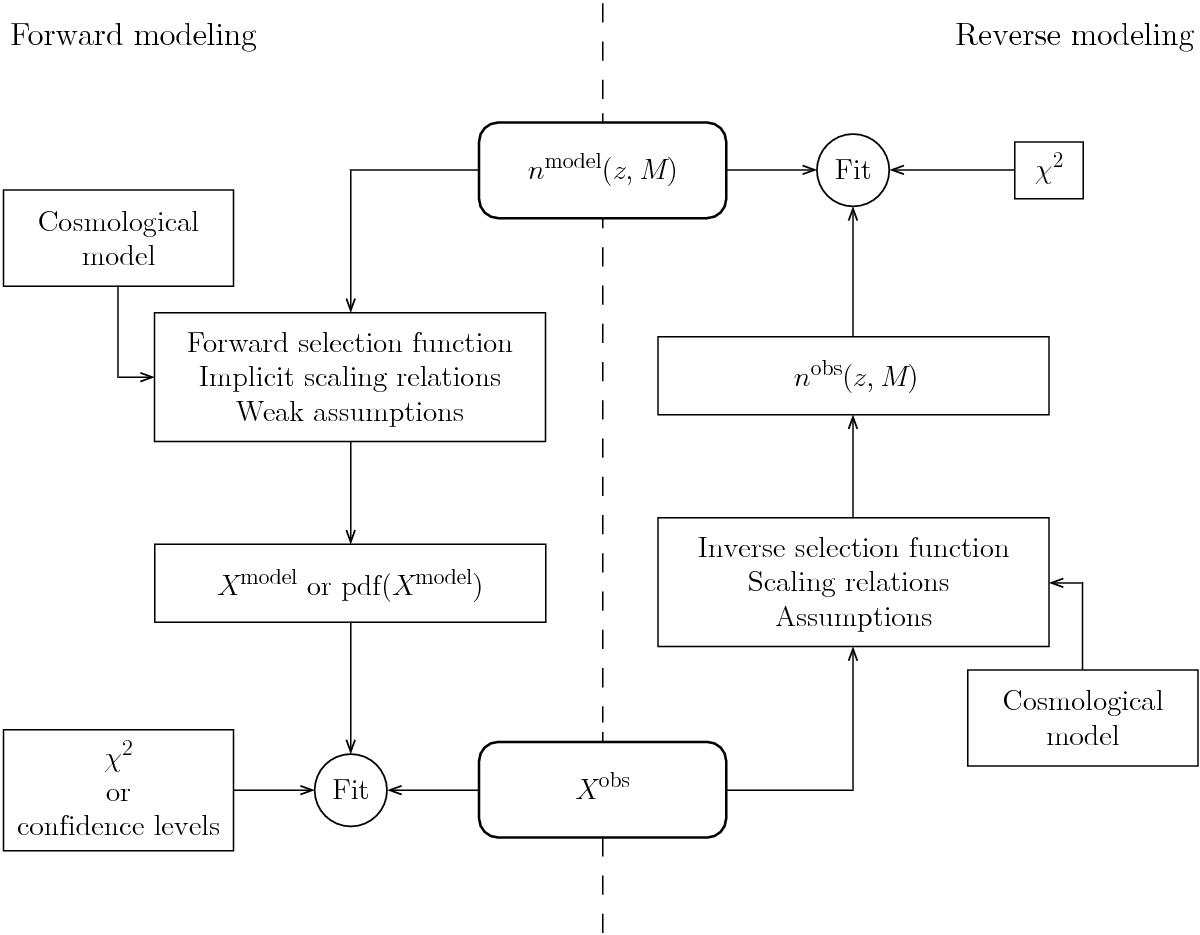
Forward- and reverse-modeling diagram for the mass function studies. Two different approaches to establishing links between the theoretical mass function (the upper round rectangle) and the observables (the lower round rectangle) are to compare the observable mass function nobs with the theoretical one (reverse modeling), or to compare “predicted” observable values Xmodel with observations (forward modeling). In this paper, the forward modeling is adopted and we propose a new method to “predict” peak conuts.
Current usage metrics show cumulative count of Article Views (full-text article views including HTML views, PDF and ePub downloads, according to the available data) and Abstracts Views on Vision4Press platform.
Data correspond to usage on the plateform after 2015. The current usage metrics is available 48-96 hours after online publication and is updated daily on week days.
Initial download of the metrics may take a while.