Fig. 5
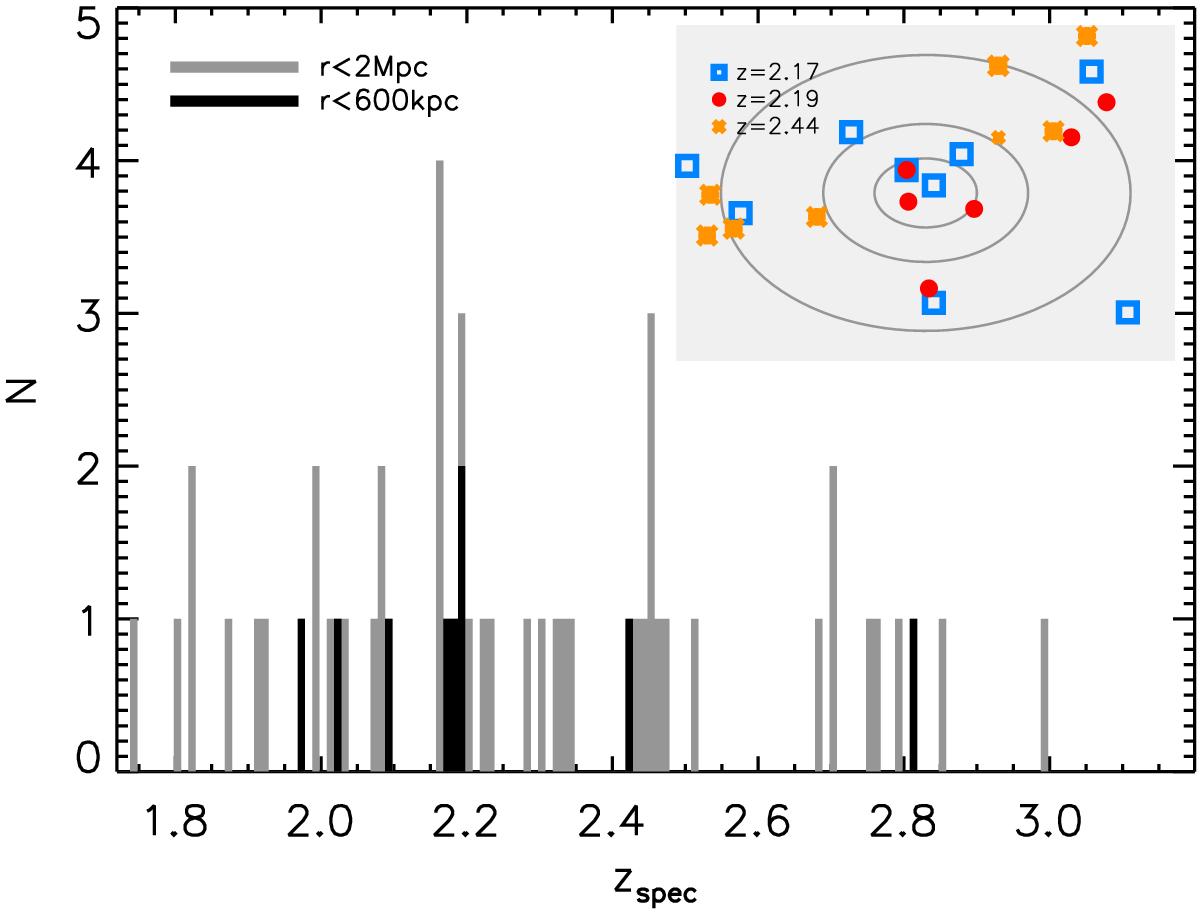
Distribution of spectroscopic redshifts around the CC0958+0158 overdensity (see text). The gray and black histograms show the distribution within 600 and 2000 kpc, respectively. The inset shows the spatial distribution around the overdensity center of galaxies within Δz ~ 0.1 (or Δz ~ 0.2, smaller symbols) of the three spikes at z ~ 2.17, 2.19, 2.44, as indicated. The three gray circles have radii of 0.5, 1, 2 Mpc proper.
Current usage metrics show cumulative count of Article Views (full-text article views including HTML views, PDF and ePub downloads, according to the available data) and Abstracts Views on Vision4Press platform.
Data correspond to usage on the plateform after 2015. The current usage metrics is available 48-96 hours after online publication and is updated daily on week days.
Initial download of the metrics may take a while.