Fig. 4
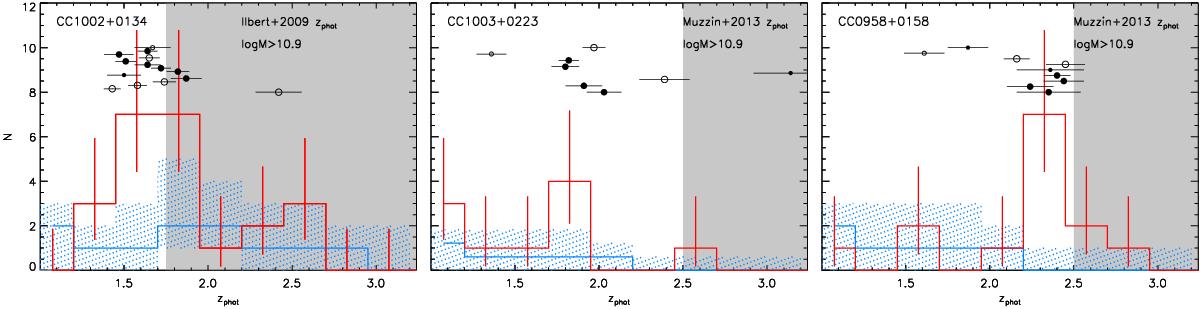
Photo-z distributions for the whole (passive and star-forming) population of log(M/M⊙) > 10.9 galaxies within an aperture of r< 600 kpc from the three passive overdensities as labeled (red lines, errors as from Gehrels 1986). Galaxies and photo-zs used here are from Muzzin et al. (2013b) for CC1003+0223 and CC0958+0158, and from Ilbert et al. (2009) for CC1002+0134 (see text). In each panel, the blue line and dotted area show the median and 16th−84th percentiles of the photo-z distribution (from the same catalogs) in r< 600 kpc apertures at 100 random positions in the COSMOS field, while the grayed-out region shows the redshift range where the sample is no longer mass-complete. Black filled (empty) circles scattered above the histograms (at random y-axis coordinates) show our photo-z determinations for the passive sample used in this work within 300 kpc (600 kpc) from the overdensity center (larger/smaller symbols show galaxies more/less massive than log(M/M⊙) = 10.9).
Current usage metrics show cumulative count of Article Views (full-text article views including HTML views, PDF and ePub downloads, according to the available data) and Abstracts Views on Vision4Press platform.
Data correspond to usage on the plateform after 2015. The current usage metrics is available 48-96 hours after online publication and is updated daily on week days.
Initial download of the metrics may take a while.