Fig. 3
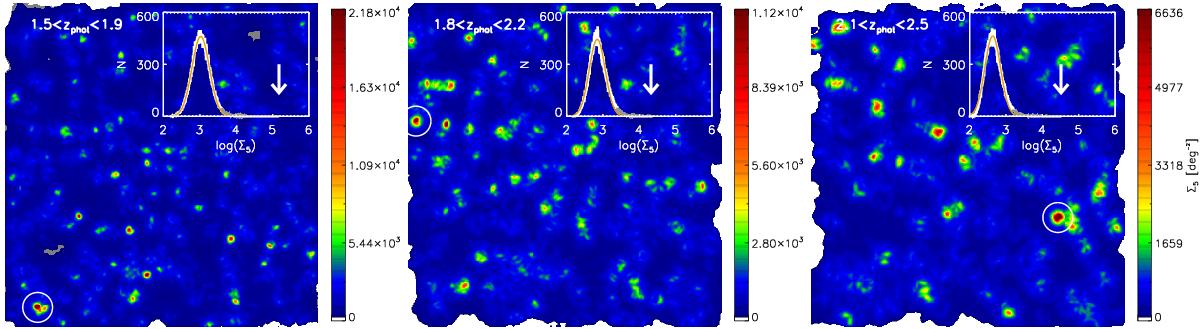
Examples of Σ5 maps in redshift slices of the full passive galaxy sample in the 2 sq. deg COSMOS field (North is up, East is left). Maps are scaled so that red colors correspond to > 5σ significance. The three candidate overdensities described in Sect. 3.1 are highlighted with white circles (2 Mpc radius proper). In each plot, the inset shows the distribution of log(Σ5) values in the map and its Gaussian fit (white and orange lines, respectively), and the white arrow shows the peak Σ5 value of the highlighted overdensity.
Current usage metrics show cumulative count of Article Views (full-text article views including HTML views, PDF and ePub downloads, according to the available data) and Abstracts Views on Vision4Press platform.
Data correspond to usage on the plateform after 2015. The current usage metrics is available 48-96 hours after online publication and is updated daily on week days.
Initial download of the metrics may take a while.