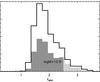
Fig. 2
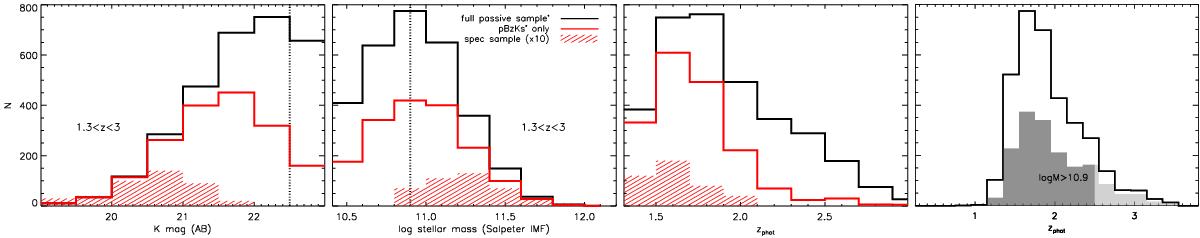
Distributions of K-band magnitude, stellar mass and photometric redshift for the sample of KAB< 23, z> 1.3 passive galaxies. Three leftmost panels: full sample (see text, black line), its pBzK subsample (red line), and the spectroscopic sample (scaled by × 10, red shaded area). Vertical dotted lines show the magnitude and mass (at z< 2.5) completeness limits of the parent K-selected catalog (see text). Rightmost panel: full photo-z distribution of the KAB< 23 passive sample (black line), and of its log(M/M⊙) > 10.9 subsample (shaded area, lighter gray at z> 2.5 where sample is beyond mass completeness).
Current usage metrics show cumulative count of Article Views (full-text article views including HTML views, PDF and ePub downloads, according to the available data) and Abstracts Views on Vision4Press platform.
Data correspond to usage on the plateform after 2015. The current usage metrics is available 48-96 hours after online publication and is updated daily on week days.
Initial download of the metrics may take a while.