Fig. 6
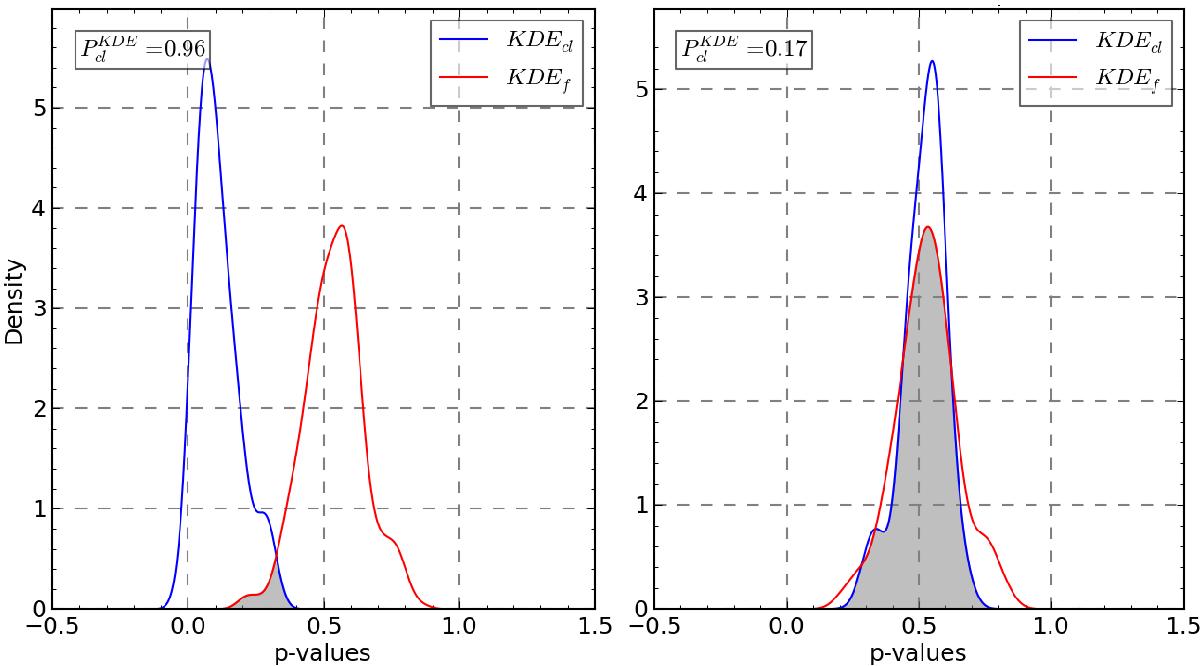
Left: function applied on a synthetic cluster. The curves are clearly separated with the blue curve (cluster vs. field regions CMD analysis) showing much lower values; the final probability value obtained is close to 1 (or 100%). Right: same analysis performed on a random field region; the curves are now quite similar, resulting in a very low probability of the region containing a true stellar cluster.
Current usage metrics show cumulative count of Article Views (full-text article views including HTML views, PDF and ePub downloads, according to the available data) and Abstracts Views on Vision4Press platform.
Data correspond to usage on the plateform after 2015. The current usage metrics is available 48-96 hours after online publication and is updated daily on week days.
Initial download of the metrics may take a while.