Free Access
Fig. 3
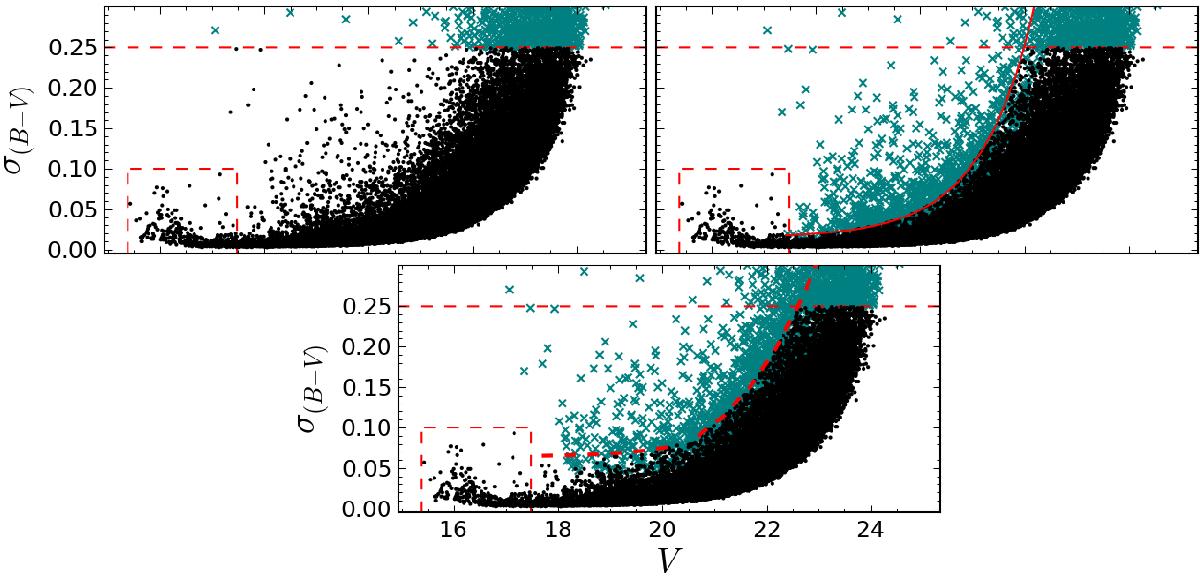
Top: maximum error rejection method (left) and exponential curve method (right). Bottom: “eye fit” method. Rejected stars are shown as green crosses, and the horizontal dashed red line is the maximum error value accepted. See text for details.
Current usage metrics show cumulative count of Article Views (full-text article views including HTML views, PDF and ePub downloads, according to the available data) and Abstracts Views on Vision4Press platform.
Data correspond to usage on the plateform after 2015. The current usage metrics is available 48-96 hours after online publication and is updated daily on week days.
Initial download of the metrics may take a while.