Fig. A.1
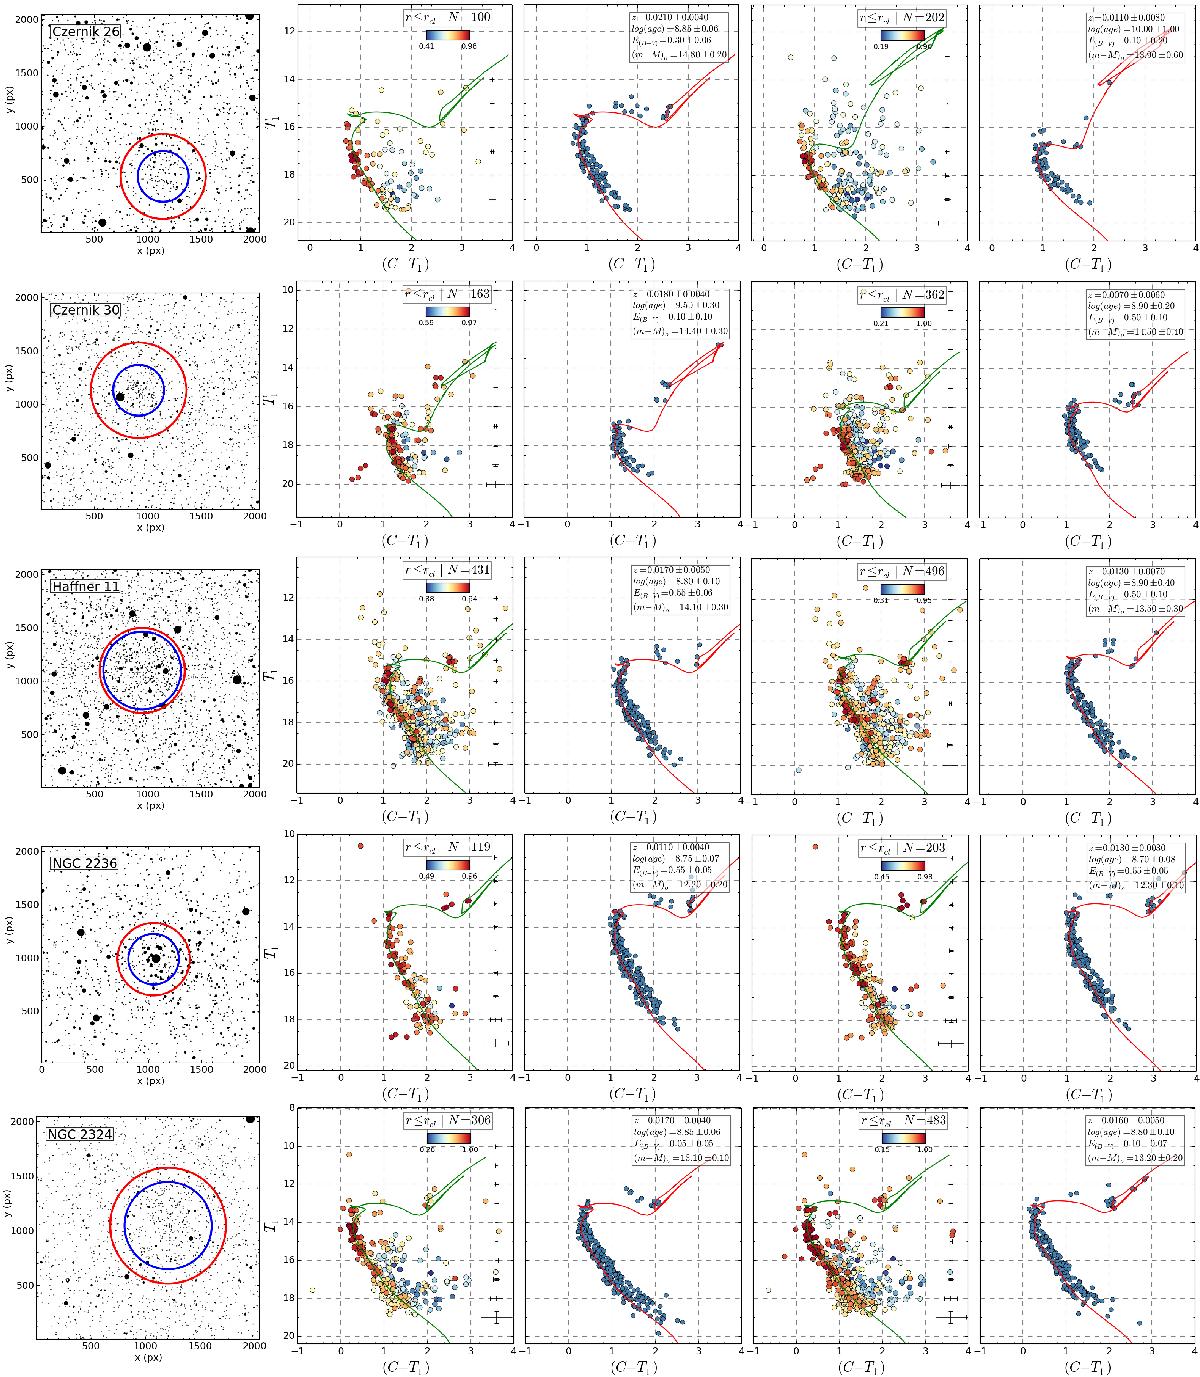
Diagrams for observed OCs analyzed with ASteCA displayed in rows for radii values assigned both manually (rcl,m) and automatically by the code (rcl,a). Leftmost plot is the star chart of the OC with rcl,m and rcl,a shown as blue and red circles, respectively. Second and third plots are the observed cluster region CMD (colored according to the MPs obtained by the DA) and best synthetic cluster found by the best-fit algorithm (see Sect. 2.9.1), respectively, using the rcl,m radius. Fourth and fifth plots are the same as the previous two, except using the rcl,a radius. Cluster parameters and their uncertainties can be seen in the top right of the best synthetic cluster CMDs and are summarized in Table 7.
Current usage metrics show cumulative count of Article Views (full-text article views including HTML views, PDF and ePub downloads, according to the available data) and Abstracts Views on Vision4Press platform.
Data correspond to usage on the plateform after 2015. The current usage metrics is available 48-96 hours after online publication and is updated daily on week days.
Initial download of the metrics may take a while.