Fig. 20
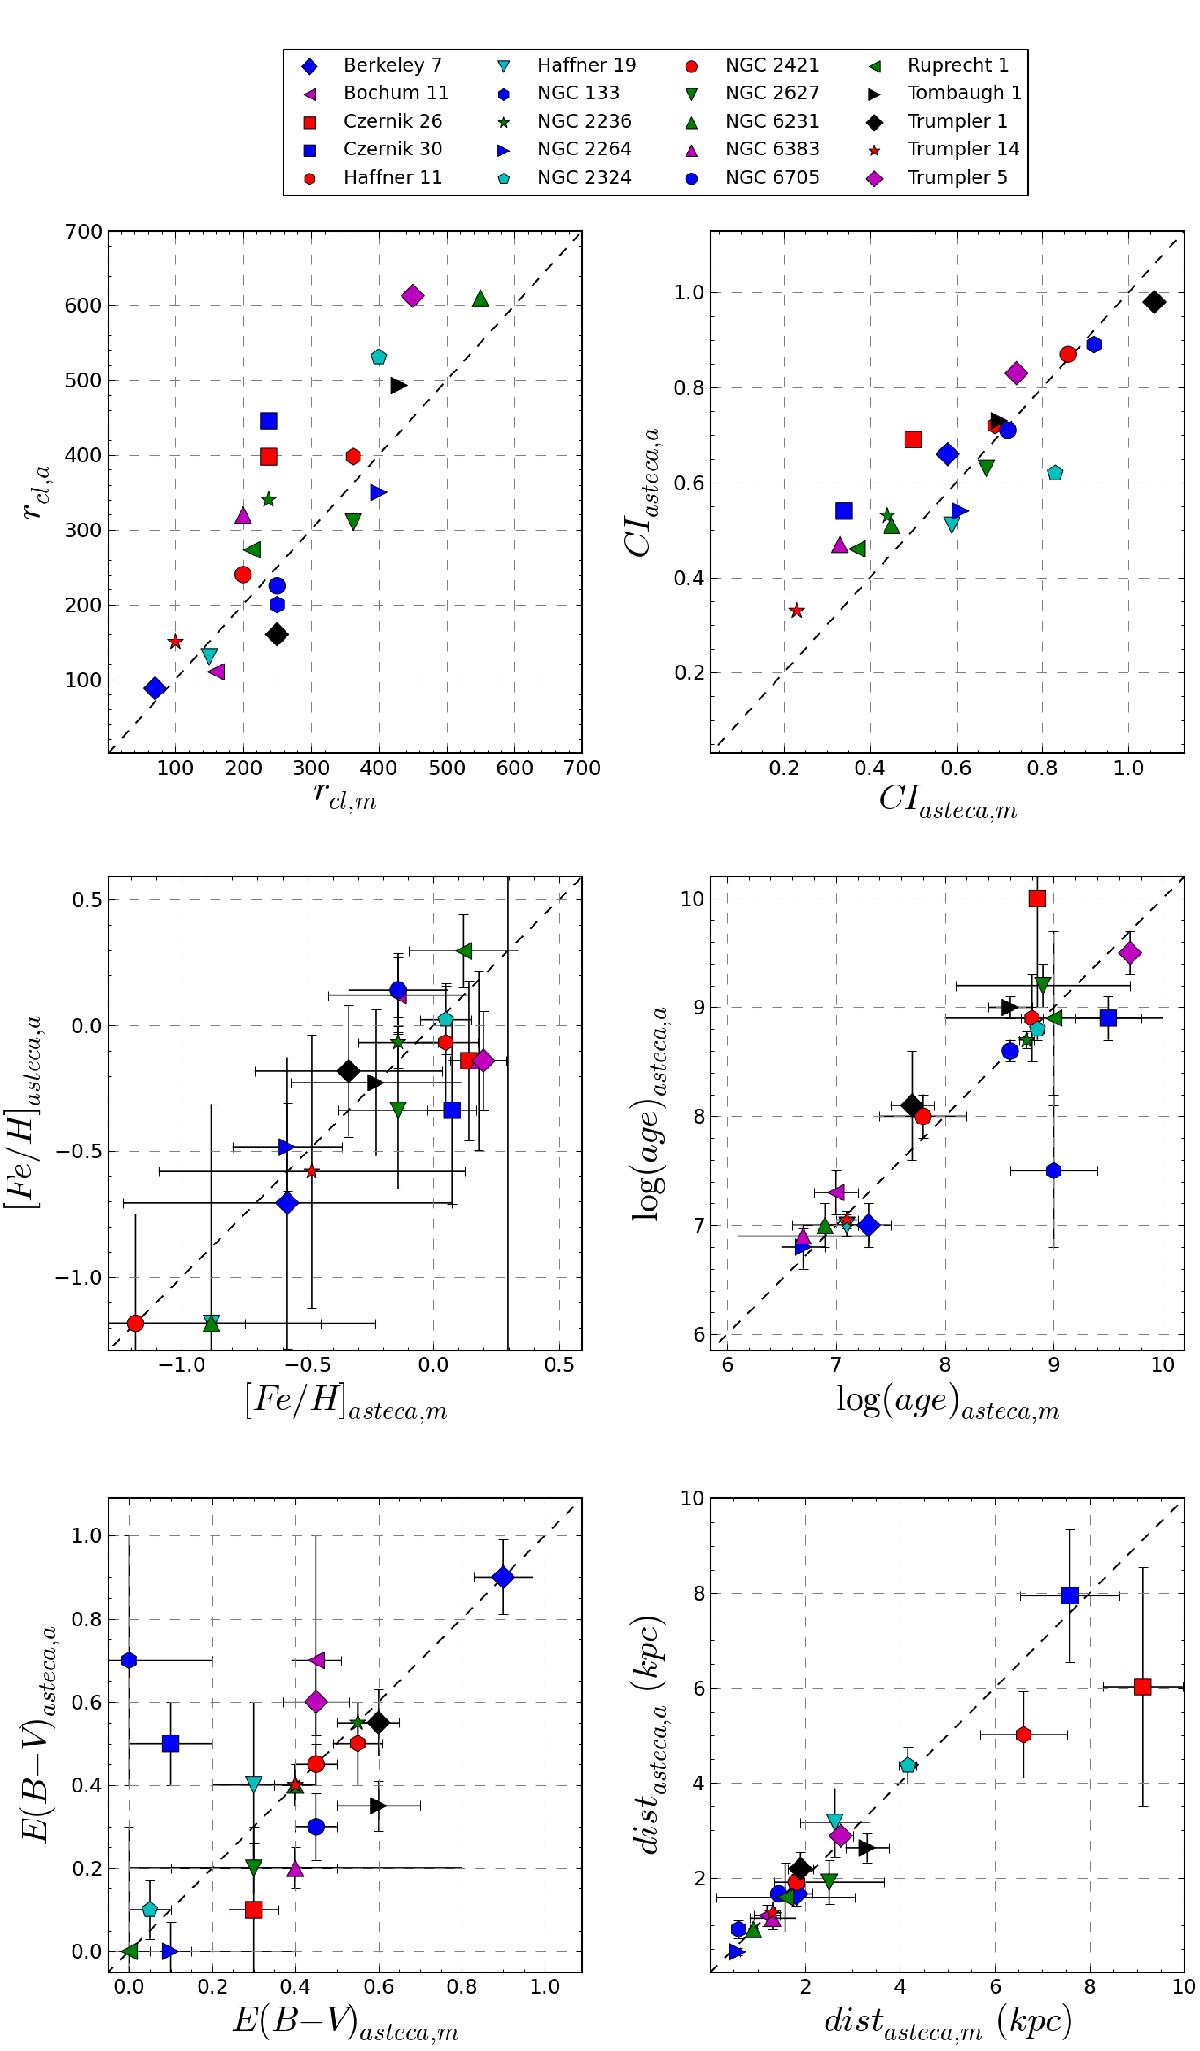
Top: manual vs. automatic radius shown in the left diagram, and CIs obtained for the OCs with each radius in the right diagram. For clusters whose coordinates are given in degrees, their radii values were rescaled for plotting purposes. Middle: metallicity and log (age) obtained by ASteCA using each radius value. Bottom: idem above for EB − V and distance.
Current usage metrics show cumulative count of Article Views (full-text article views including HTML views, PDF and ePub downloads, according to the available data) and Abstracts Views on Vision4Press platform.
Data correspond to usage on the plateform after 2015. The current usage metrics is available 48-96 hours after online publication and is updated daily on week days.
Initial download of the metrics may take a while.