Fig. 14
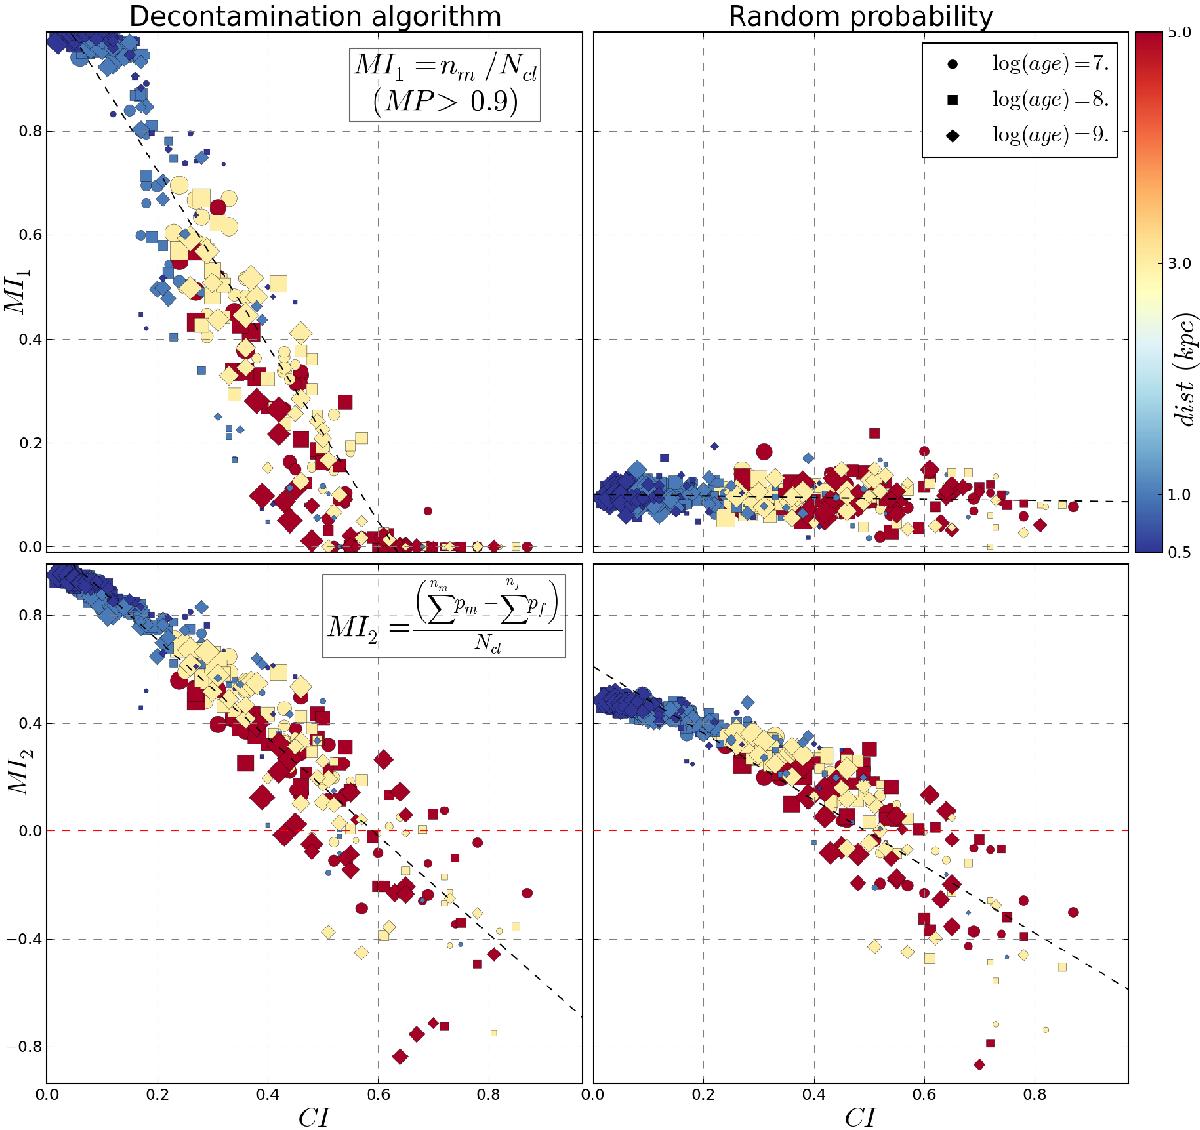
Top left: member index defined in Eq. (19) vs. contamination index. Top right: same MI vs. CI plot except using the membership probabilities given by the random assignment algorithm. Bottom left: member index defined in Eq. (20) vs. contamination index. Bottom right: same MI vs. CI plot except using the membership probabilities given by the random assignment algorithm. Linear fits in each plot shown as dashed black lines. Sizes, shapes, and colors as in Fig. 12.
Current usage metrics show cumulative count of Article Views (full-text article views including HTML views, PDF and ePub downloads, according to the available data) and Abstracts Views on Vision4Press platform.
Data correspond to usage on the plateform after 2015. The current usage metrics is available 48-96 hours after online publication and is updated daily on week days.
Initial download of the metrics may take a while.