Fig. 13
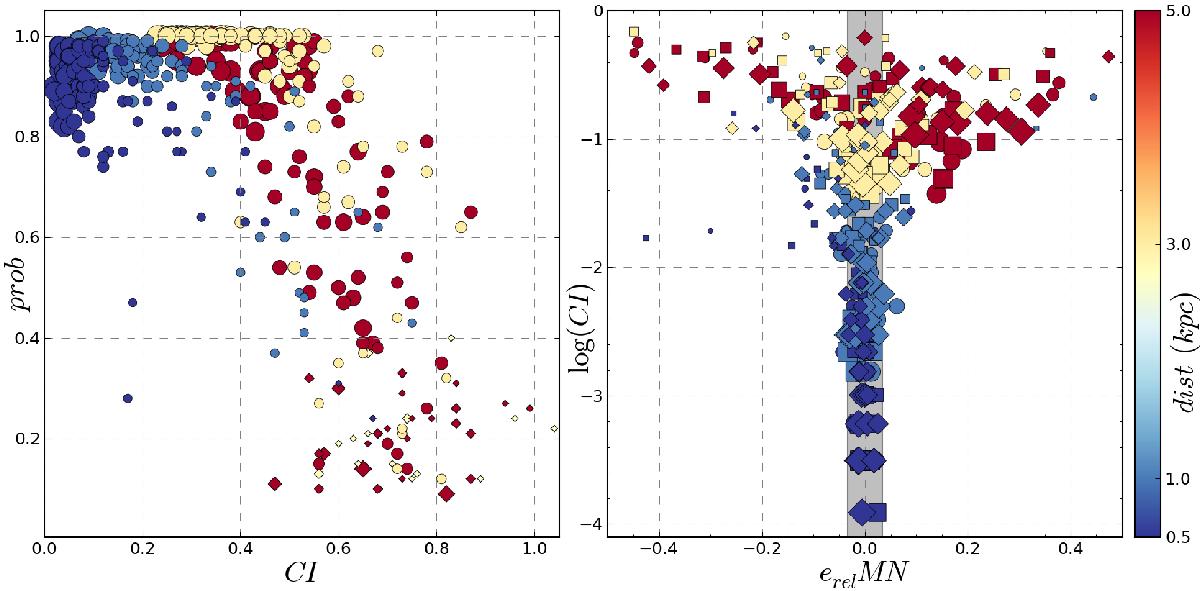
Left: distribution of real cluster probabilities vs. CI. Sizes vary according to the initial masses (bigger size means larger initial mass) and colors according to the distance (see colorbar to the right). Circles represent values for SOCs and diamonds values obtained for field regions. Right: logarithm of the CI vs. relative error for the true number of members and that predicted by ASteCA for each SOC. Point markers are associated with ages as shown in the legend. The shaded region marks the range where 50% of all SOCs are positioned.
Current usage metrics show cumulative count of Article Views (full-text article views including HTML views, PDF and ePub downloads, according to the available data) and Abstracts Views on Vision4Press platform.
Data correspond to usage on the plateform after 2015. The current usage metrics is available 48-96 hours after online publication and is updated daily on week days.
Initial download of the metrics may take a while.