Fig. 12
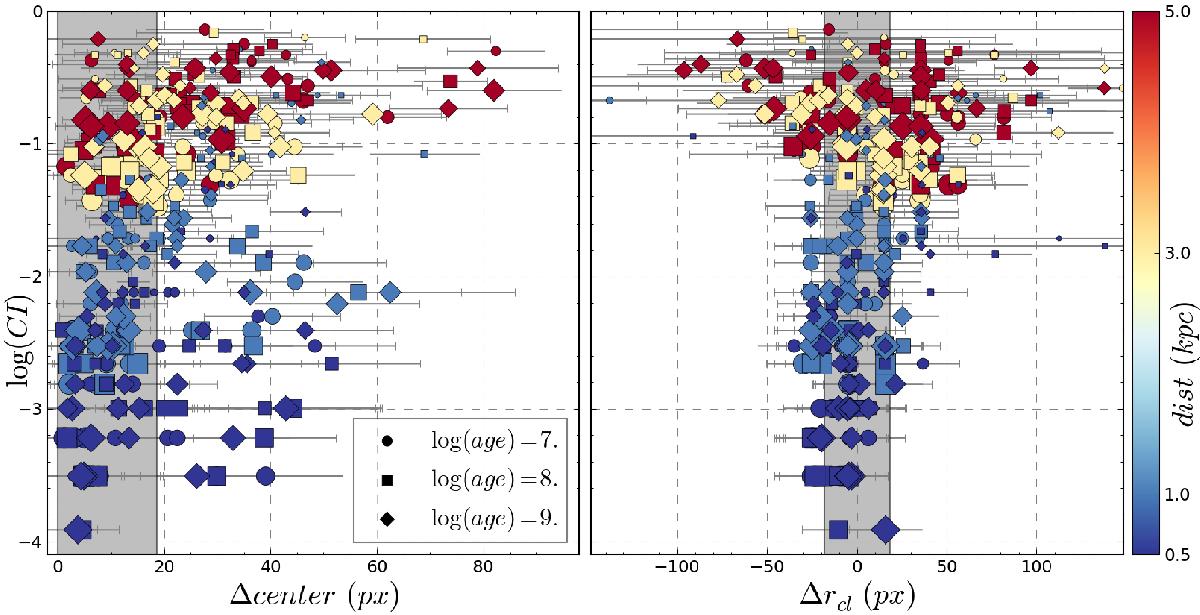
Left: logarithm of the CI vs. difference in center assigned by ASteCA with true center. Sizes vary according to the initial masses (larger mean larger initial mass) and colors according to the distance (see colorbar to the right). Right: logarithm of the CI vs. radius difference (ASteCA minus true value) for each SOC. In both plots shaded regions mark the range where 50% of all SOCs are positioned and estimated errors are shown as gray lines.
Current usage metrics show cumulative count of Article Views (full-text article views including HTML views, PDF and ePub downloads, according to the available data) and Abstracts Views on Vision4Press platform.
Data correspond to usage on the plateform after 2015. The current usage metrics is available 48-96 hours after online publication and is updated daily on week days.
Initial download of the metrics may take a while.