Fig. 10
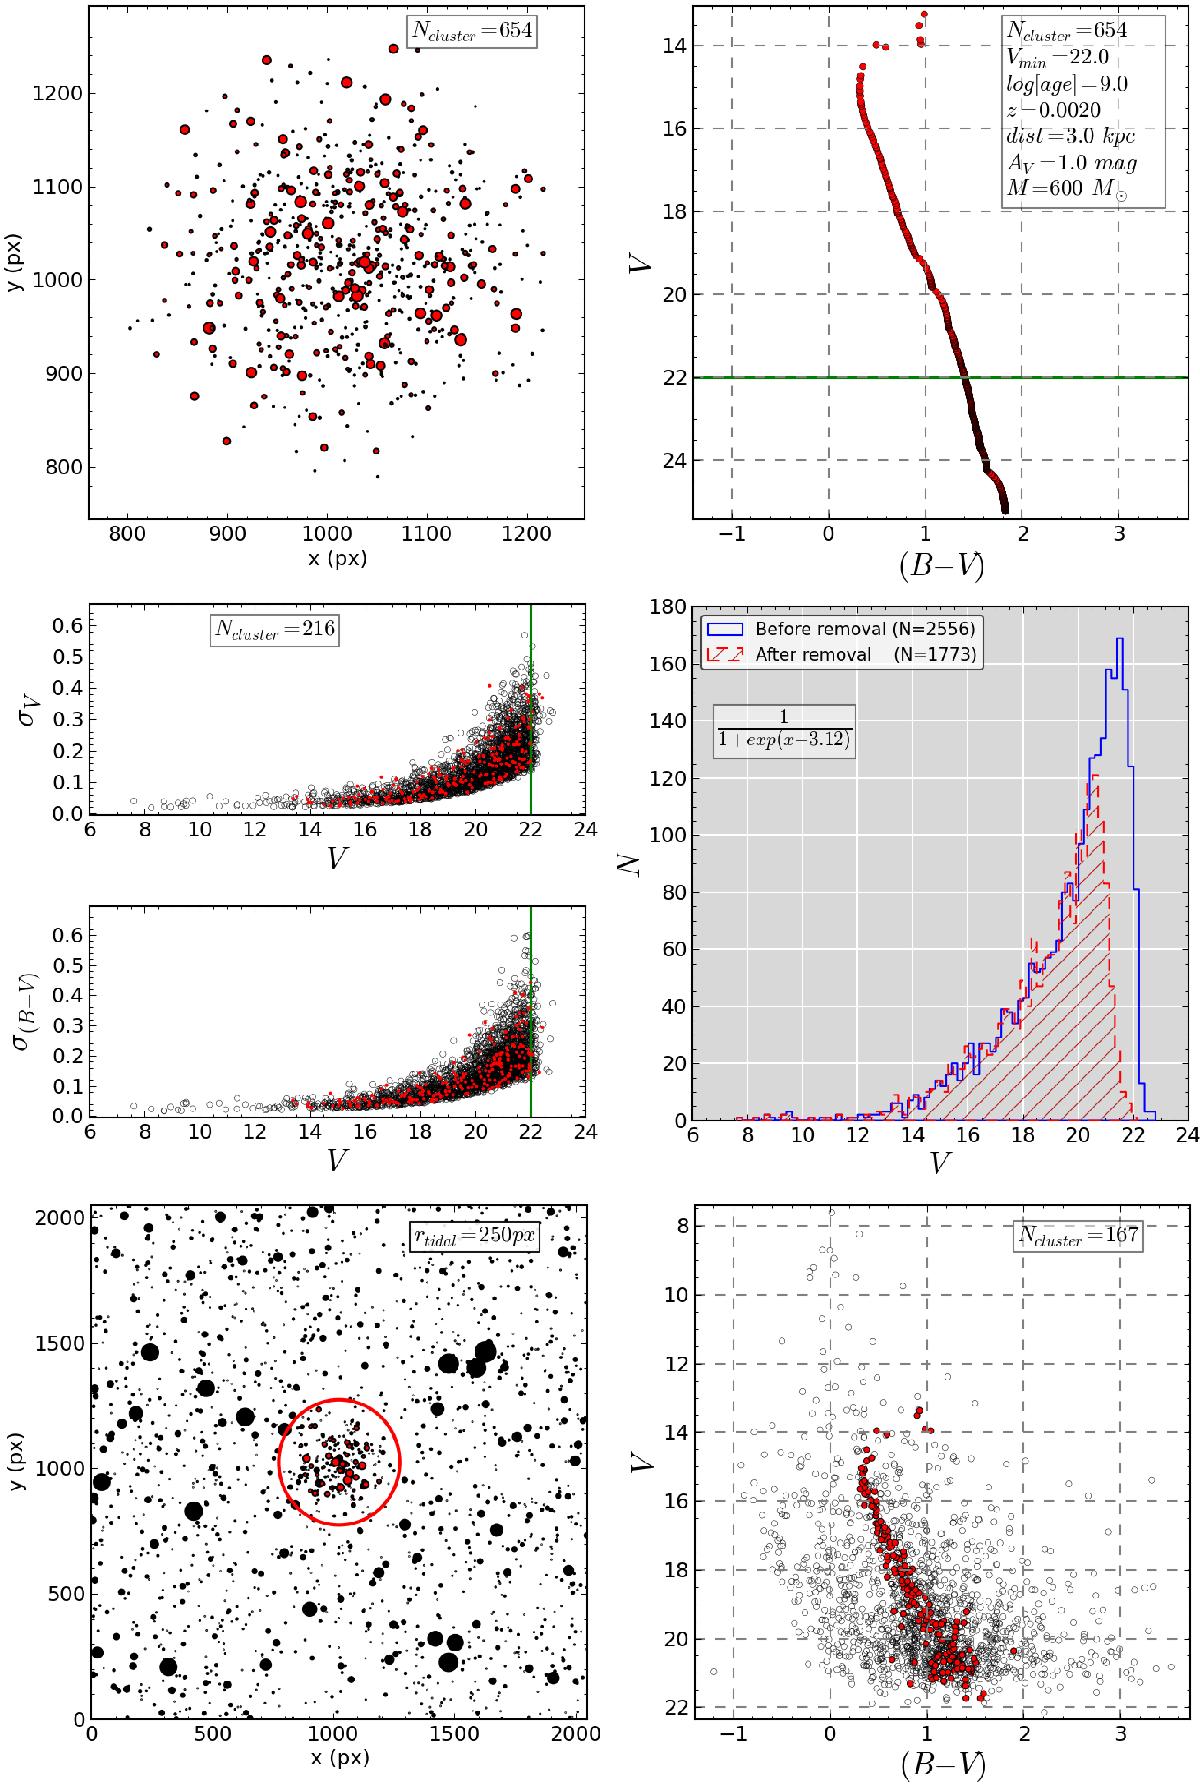
Top: spatial distribution (left) of a SOC according to the parameters labeled in the respective CMD (right), wherein the green line indicates the magnitude limit adopted in the validation. Red symbols refer to cluster stars. Middle: photometric errors (left) and the completeness function (right) adopted. Bottom: resulting cluster star spatial distribution (left) with a circle representing the tidal radius and the corresponding CMD (right).
Current usage metrics show cumulative count of Article Views (full-text article views including HTML views, PDF and ePub downloads, according to the available data) and Abstracts Views on Vision4Press platform.
Data correspond to usage on the plateform after 2015. The current usage metrics is available 48-96 hours after online publication and is updated daily on week days.
Initial download of the metrics may take a while.