Fig. 2
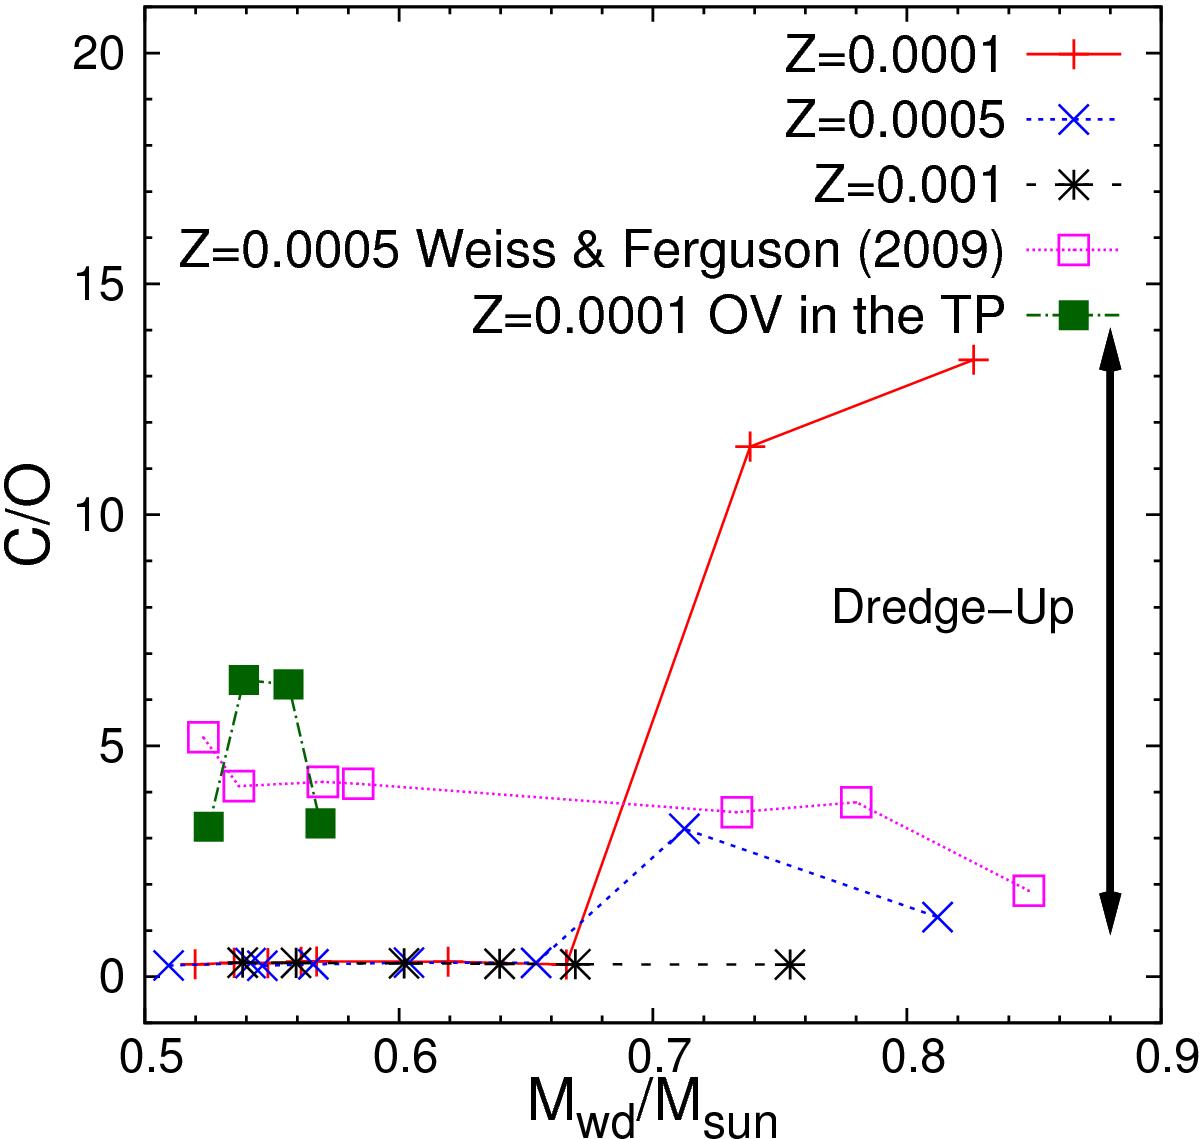
Ratio of the carbon-to-oxygen abundances at the end of the TP-AGB phase as a function of the white dwarf mass for Z = 0.0001,0.0005, and Z = 0.001 progenitors – solid, dotted, and dashed lines, respectively. In addition, we show with filled and hollow squares the predictions from our low-mass Z = 0.0001 progenitors in the case that overshooting is considered during the TP-AGB phase and the corresponding results of Weiss & Ferguson (2009) for Z = 0.0005 progenitors.
Current usage metrics show cumulative count of Article Views (full-text article views including HTML views, PDF and ePub downloads, according to the available data) and Abstracts Views on Vision4Press platform.
Data correspond to usage on the plateform after 2015. The current usage metrics is available 48-96 hours after online publication and is updated daily on week days.
Initial download of the metrics may take a while.