Fig. 9
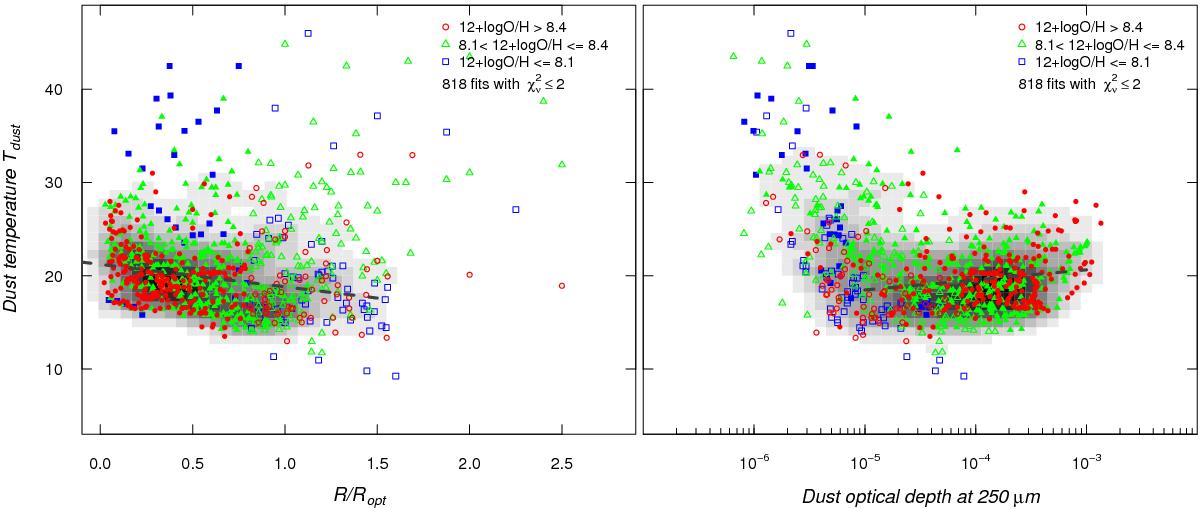
Left panel: dust temperature Tdust vs. normalized galactocentric distance R/Ropt; right panel: Tdust vs. τdust evaluated at 250 μm. As in Fig. 8, points are coded by their oxygen abundance, with filled symbols corresponding to R/Ropt≤ 0.8 and open ones to larger radii. The underlying grayscale shows the two-dimensional density distribution of the data. The dashed lines are unweighted linear regressions to the data points, excluding outliers with Tdust≥ 30 K (in the left panel, Tdust = −2.41 R/Ropt + 21.2).
Current usage metrics show cumulative count of Article Views (full-text article views including HTML views, PDF and ePub downloads, according to the available data) and Abstracts Views on Vision4Press platform.
Data correspond to usage on the plateform after 2015. The current usage metrics is available 48-96 hours after online publication and is updated daily on week days.
Initial download of the metrics may take a while.