Fig. 2
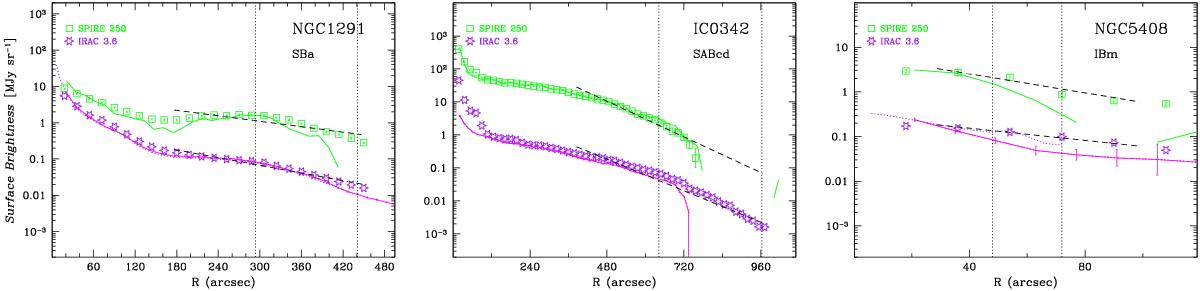
Radial surface brightness profiles at IRAC 3.6 μm and SPIRE 250 μm shown in log-linear scale (cf., Fig. 7 with log-log) for NGC 1291 (left panel), IC 342 (middle), and NGC 5408 (right). Open (green) squares show the 250 μm profiles and open (purple) stars 3.6 μm. The IRAC 3.6 μm profiles from from Muñoz-Mateos (priv. comm.) correspond to solid (purple) curves, and the 250 μm profiles extracted in a similar way (i.e., without the convolution by Aniano et al. 2012) as solid (green) curves. The dashed regression lines indicate the best-fit disk model fitted from 0.6*Ropt; The vertical dotted lines indicate the optical radius, Ropt, and 1.5 Ropt.
Current usage metrics show cumulative count of Article Views (full-text article views including HTML views, PDF and ePub downloads, according to the available data) and Abstracts Views on Vision4Press platform.
Data correspond to usage on the plateform after 2015. The current usage metrics is available 48-96 hours after online publication and is updated daily on week days.
Initial download of the metrics may take a while.