Fig. 19
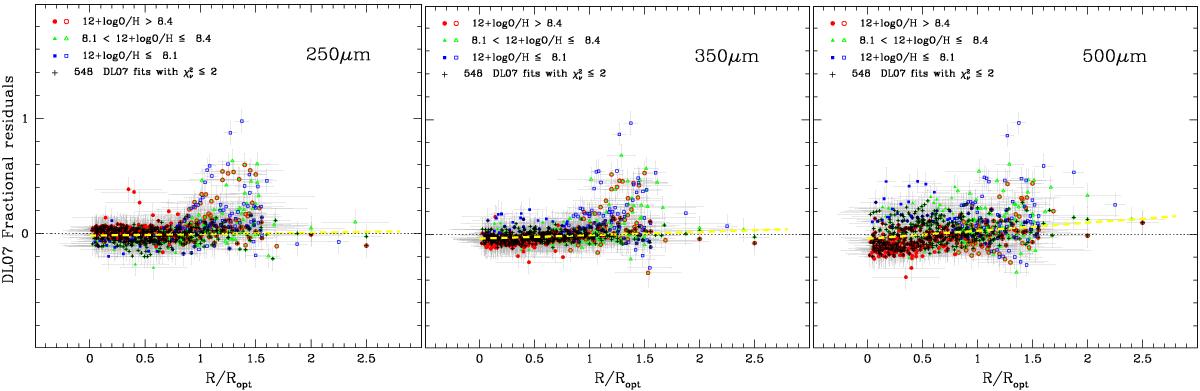
SPIRE fractional residuals of the DL07 best fits plotted against the normalized radius, R/Ropt. As explained in the text, fractional residuals are defined as (Fν − FDL07)/Fν; 250 μm residuals are shown in the left panel, 350 μm in the middle, and 500 μm in the right. As in Fig. 18, data points are coded by O/H with (red) circles showing 12 + log (O/H)> 8.4, (green) triangles 8.0 <12 + log (O/H)≤ 8.4, and (blue) squares 12 + log (O/H)≤ 8.1. Filled symbols correspond to positions with normalized (to optical radius Ropt) radii within R/Ropt≤ 0.8, and open symbols to larger radii. As in Fig. 18, we show all data with S/N ≥ 3 independently of their ![]() ; the DL07 fits with
; the DL07 fits with ![]() ≤ 2 are indicated by +. The (yellow) dashed lines give the linear regressions described in the text.
≤ 2 are indicated by +. The (yellow) dashed lines give the linear regressions described in the text.
Current usage metrics show cumulative count of Article Views (full-text article views including HTML views, PDF and ePub downloads, according to the available data) and Abstracts Views on Vision4Press platform.
Data correspond to usage on the plateform after 2015. The current usage metrics is available 48-96 hours after online publication and is updated daily on week days.
Initial download of the metrics may take a while.