Free Access
Fig. 17
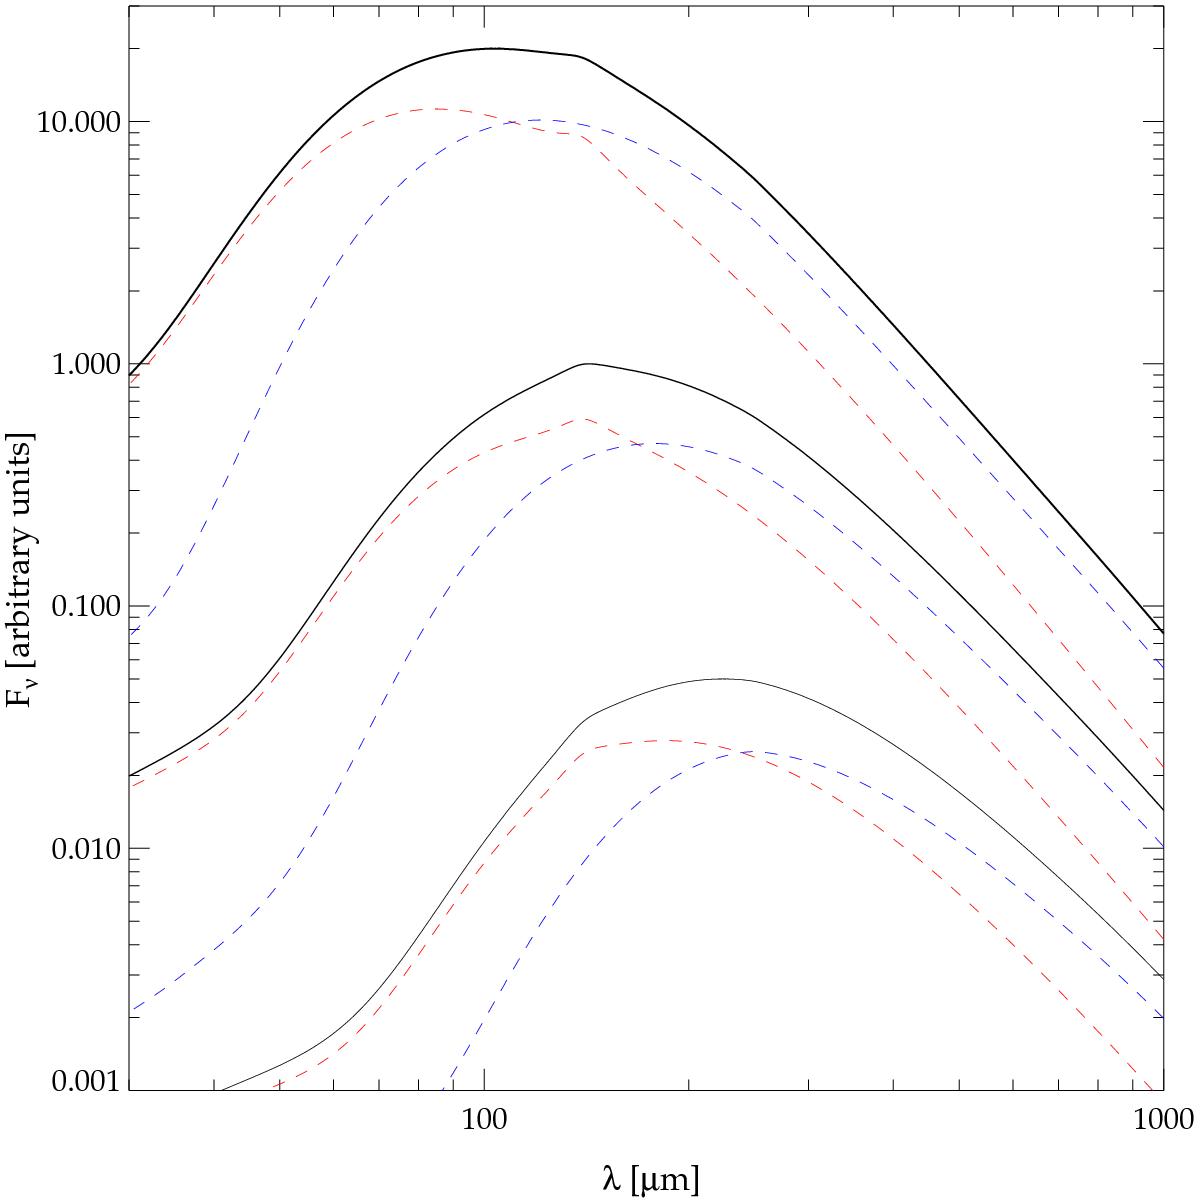
SEDs of DL07 models with ISRF ≡Umin. Three values of Umin are shown: from lower to upper curves Umin = 0.1, 1.0, 10.0. Total emission is given by the solid (black) curve. The blue dashed curves correspond to the contribution from silicates and the red to carbonaceous grains (including graphite, ionized and neutral PAHs).
Current usage metrics show cumulative count of Article Views (full-text article views including HTML views, PDF and ePub downloads, according to the available data) and Abstracts Views on Vision4Press platform.
Data correspond to usage on the plateform after 2015. The current usage metrics is available 48-96 hours after online publication and is updated daily on week days.
Initial download of the metrics may take a while.